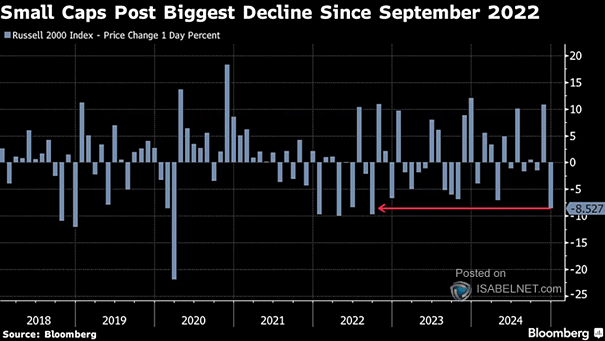
U.S. 10Y-2Y Yield Curve and Recessions

U.S. 10Y-2Y Yield Curve and Recessions When a recession is avoided, an un-inversion in the 2s10s U.S. Treasury yield curve may suggest a favorable outlook for U.S. stocks. Image: Goldman Sachs Global Investment Research

What Do You Think Is Currently the Most Crowded Trade?

What Do You Think Is Currently the Most Crowded Trade? For FMS investors, the “Long Magnificent Seven” trade continues to be the most crowded, largely attributed to the impressive performance and market leadership of these tech stocks. Image: BofA Global Fund Manager Survey

Median Index Returns Following First Fed Rate Cut

Median Index Returns Following First Fed Rate Cut Historically, midcaps have outperformed the S&P 500 and the Russell 2000 in the three and twelve months following the initial Federal Reserve rate cut. Image: Goldman Sachs Global Investment Research

FMS Net % Expecting Stronger Economy vs. S&P 500

FMS Net % Expecting Stronger Economy vs. S&P 500 FMS investors remain pessimistic, anticipating a weak global economy over the next 12 months, resulting in a widening gap between their macroeconomic views and the performance of U.S. equities. Image: BofA Global Fund Manager Survey

When Will the U.S. Economy Go into Recession?

When Will the U.S. Economy Go into Recession? The majority of FMS investors do not currently expect a U.S. recession in the next 18 months, while only 8% foresee one in the second half of 2024 and 35% predict a recession in 2025. Image: BofA Global Fund Manager Survey

2-Year U.S. Treasury Yield – Fed Funds Rate

2-Year U.S. Treasury Yield – Fed Funds Rate The current spread between the 2-year U.S. Treasury yield and the federal funds rate suggests that the bond market perceives the Federal Reserve’s monetary policy as tight. Image: Morgan Stanley Wealth Management

FMS Investors – Net % Taking Higher than Normal Risk Levels

FMS Investors – Net % Taking Higher than Normal Risk Levels In September, FMS risk appetite has significantly decreased, reaching a 11-month low. This decline reflects growing concerns among FMS investors regarding economic stability and market conditions. Image: BofA Global Fund Manager Survey

S&P 500 Down >4% Then Up >4% on Consecutive Weeks

S&P 500 Down >4% Then Up >4% on Consecutive Weeks When the S&P 500 experiences a drop of more than 4% in one week followed by a rise of more than 4% the next week, historical data indicates a bullish trend over the next 12 months, with a median gain of 18.8% since 1950. Image:…

U.S. Dollar Index and Rest of the World GDP

U.S. Dollar Index and Rest of the World GDP A weaker U.S. dollar typically bodes well for the global economy by boosting growth prospects, improving trade dynamics, and encouraging investment in international markets. Image: BofA Predictive Analytics