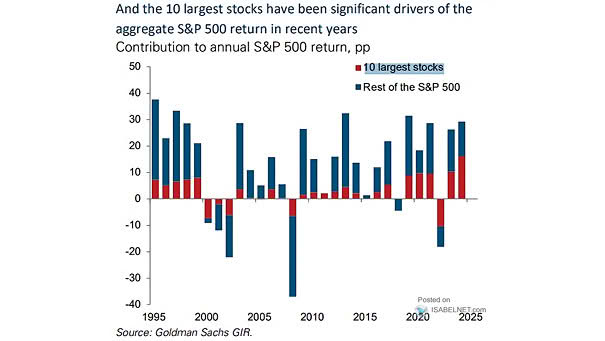
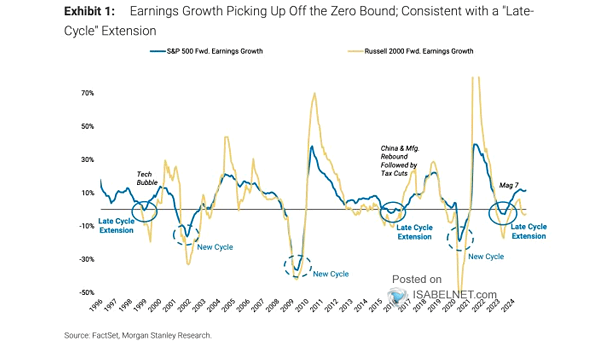
Weekly Financials Flows
Weekly Financials Flows Outflows from financial equity funds highlight a cautious approach from investors, reflecting broader economic concerns and market volatility. Image: BofA Global Investment Strategy
S&P 500 Index Daily Returns Monday is the worst day of the week for the S&P 500 index since 1928, indicating a long-standing trend that market participants might consider when planning their strategies to potentially enhance their stock market performance. Image: Carson Investment Research
5-Year U.S. Treasury Yield vs. Bank Stocks Correlation The combination of higher bond yields and rising bank stocks is often often viewed as a sign of a bullish market environment. Image: BofA Global Investment Strategy
Inequality – U.S. Household Net Worth by Brackets The widening wealth gap in the U.S. reflects deep-rooted structural issues that have persisted for decades. While some groups have gained, the overall trend indicates a growing divide that challenges economic mobility and social equity. Image: Real Investment Advice
Elections – U.S. Voting Age Population Younger generations, specifically Millennials and Generation Z, are projected to become the new majority voting bloc in the upcoming 2024 U.S. presidential election, marking a significant generational shift in the electorate. Image: BofA Global Investment Strategy
U.S. ISM Manufacturing PMI vs. 10-Year U.S. Treasury Yield Easing rate pressure is projected to facilitate a recovery in U.S. manufacturing as financial conditions improve, inflation declines, and both domestic and foreign demand strengthen. Image: BofA US Equity & Quant Strategy
Global Equities Flows In August, global equity funds saw significant outflows, the largest since 2022, reflecting a cautious sentiment among investors. Image: J.P. Morgan
S&P 500 Down >1.5%, But Closes Up >1% on the Day Big reversal days, such as yesterday, have typically shown bullish trends in the U.S. stock market over the next 12 months, with a median gain of 16.1% since 1970. Image: Carson Investment Research
Seasonality – Average Daily Performance of the S&P 500 Although the S&P 500 benefits from robust earnings growth and positive expectations for monetary policy, U.S. stocks often experience weakness in September and October. Image: Deutsche Bank
Valuation – Relative Forward P/E: Russell 2000 vs. Russell 1000 Small-caps may be an attractive option for long-term investors looking to diversify their investment portfolios, as they offer relatively cheaper valuations compared to large-caps. Image: BofA US Equity & Quant Strategy
U.S. Job Openings and S&P 500 While job openings provide a snapshot of current economic conditions, the stock market reflects investor sentiment and expectations about the future. Image: BofA Global Investment Strategy