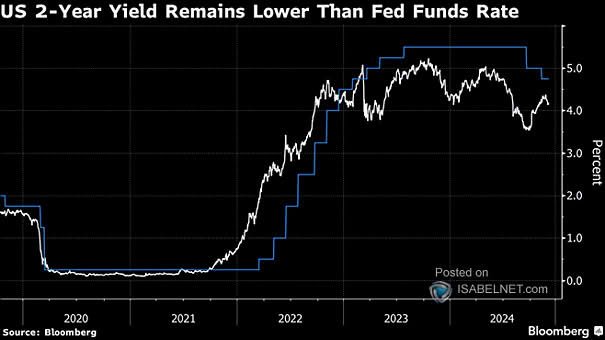
S&P 500 Normalized P/E vs. Subsequent Annualized Returns

S&P 500 Normalized P/E vs. Subsequent Annualized Returns Current high valuations in the U.S. stock market, particularly within the technology sector, suggest that investors may face lackluster returns over the next decade. Image: BofA US Equity & Quant Strategy

List of Signals to Watch for a Market Peak

List of Signals to Watch for a Market Peak As of now, 50% of the 10 indicators for market peaks have been triggered, compared to an average of 70% during previous market peaks. This implies that the U.S. market may still be on the rise and has not yet peaked. Image: BofA US Equity &…

EPS Growth – Political Party and S&P 500 Profits Cycle

EPS Growth – Political Party and S&P 500 Profits Cycle While election results can impact markets in the short term, the underlying profitability of companies is a stronger driver of stock prices over time. Image: BofA US Equity & US Quant Strategy

Return – U.S. Tech Stocks

U.S. Tech Stocks During the first half of 2024, large U.S. tech companies have significantly outperformed their smaller counterparts, reflecting the ongoing dominance of major players in the tech industry. Image: BofA US Equity & Quant Strategy

Survey – Percentage of Investors Expecting Landing Scenarios

Survey – Percentage of Investors Expecting Landing Scenarios In BofA’s August credit investor survey, 74% of investors anticipate a soft landing, reflecting a significant increase in optimism despite recent market volatility. Image: BofA Global Research

Emerging Markets vs. Developed Markets

Emerging Markets vs. Developed Markets Emerging economies, despite their vast populations and potential for growth, have not yet achieved a corresponding level of representation in global equity markets. Image: BofA Global Investment Strategy

U.S. Federal Funds Effective Rate Less CPI

U.S. Federal Funds Effective Rate Less CPI To combat inflation, the Fed has raised interest rates aggressively to their highest level in years, resulting in the real federal funds rate reaching a post-GFC high. Image: Deutsche Bank Research

Valuation – Relative Forward P/E of Russell 1000 Value vs. Growth Indices

Valuation – Relative Forward P/E of Russell 1000 Value vs. Growth Indices The current landscape for value and growth investing reveals a significant and persistent valuation gap, with value stocks trading at lower prices relative to their growth counterparts. Image: BofA US Equity & Quant Strategy

Performance of $10,000 Invested in the S&P 500 the Past 20 Years

Performance of $10,000 Invested in the S&P 500 the Past 20 Years Considering the challenges of market timing, particularly the risk of missing the market’s best days, most investors would benefit more from adopting a long-term investment strategy. Image: Carson Investment Research

S&P 500 – Short Interest on the SPY and QQQ U.S. ETFs

S&P 500 – Short Interest on the SPY and QQQ U.S. ETFs Low short interest in the SPY and QQQ U.S. ETFs suggests little speculation on price declines, which affects market dynamics by lowering the potential for a short squeeze. Image: J.P. Morgan

S&P 500 1-Day Move to CPI

S&P 500 1-Day Move to CPI The U.S. equity market’s response to CPI data is becoming less pronounced, influenced by shifting investor sentiment about interest rates and overall economic conditions. Image: BofA Global Research