U.S. Real Yields
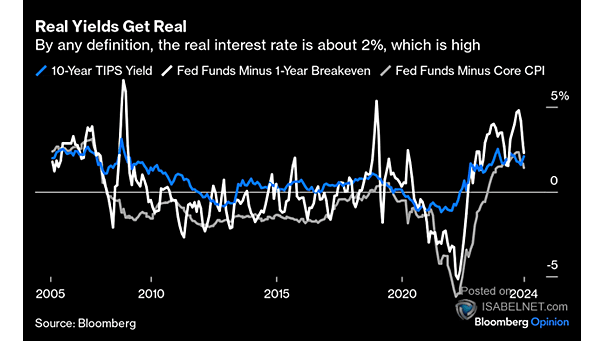
U.S. Real Yields While not extreme, the current U.S. real interest rate of about 2% is relatively high, reflecting a restrictive monetary policy aimed at bringing inflation under control. Image: Bloomberg
U.S. Real Yields While not extreme, the current U.S. real interest rate of about 2% is relatively high, reflecting a restrictive monetary policy aimed at bringing inflation under control. Image: Bloomberg

ISABELNET Cartoon of the Day Being a bear on Earth in 2024 is hard enough, with the S&P 500 gaining 26% YTD including dividends. How about a one-way trip to Mars? It’s so cold there that a bear could hibernate for the entire journey! Happy Friday, Everyone! 😎
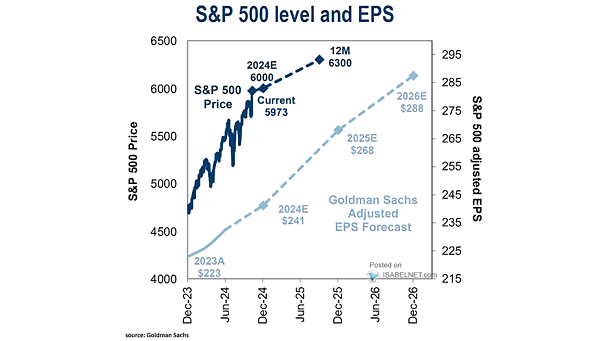
S&P 500 Level and EPS Driven by expectations of robust earnings per share growth, Goldman Sachs has set its 12-month S&P 500 price target at 6,300. Image: Goldman Sachs Global Investment Research

ISABELNET Cartoon of the Day With Republicans achieving a trifecta by winning the House, Senate, and presidency, Democrats will find it difficult to advance their policy agenda. Historically, markets have performed best under a divided Congress. Have a Great Day, Everyone! 😎
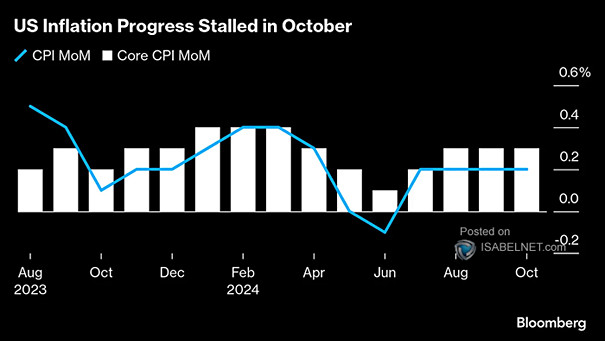
U.S. Headline and Core CPI Inflation The latest inflation data for October 2024 indicates that U.S. inflation has remained firm, showing a slight uptick rather than continuing its irregular descent, suggesting that the Fed’s battle against inflation is not yet over. Image: Bloomberg
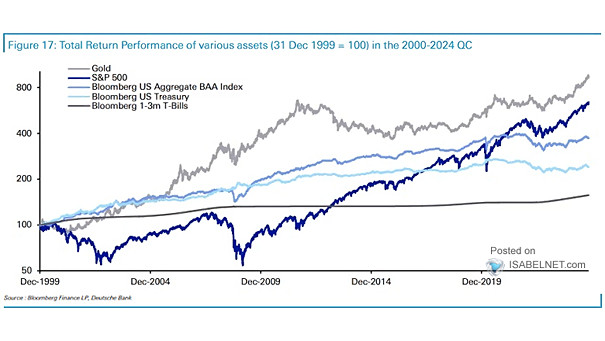
Total Return Performance of Various Assets Despite Warren Buffett’s skepticism towards gold as an investment, the precious metal has outperformed both U.S. equities and U.S. Treasury bonds over the past 25 years. Image: Deutsche Bank
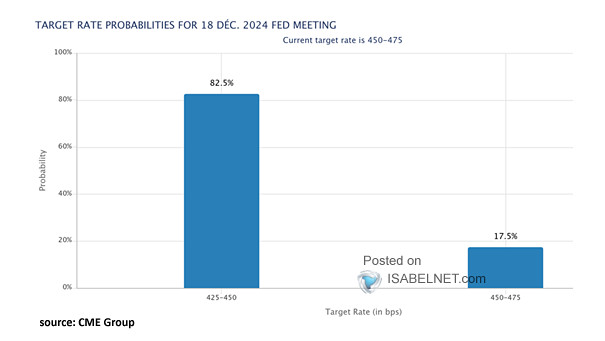
Probability of Fed Rate Cut After the CPI data release, traders now estimate an 82.5% chance of a 25 basis point rate cut at the FOMC meeting on December 18, 2024. Image: CME GRoup
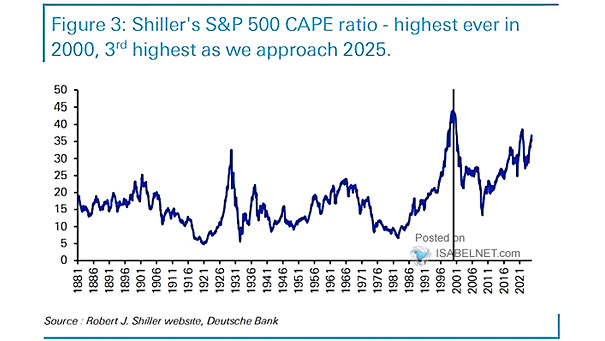
Valuation – S&P 500 CAPE Ratio A high CAPE ratio suggests caution but isn’t a reliable market timing indicator. Markets may remain overvalued for extended periods, typically leading to subdued long-term equity returns. Image: Deutsche Bank
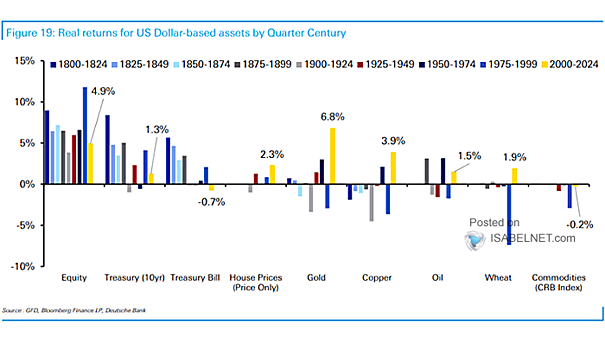
Real Returns for U.S. Dollar-based Assets by Quarter Century While there have been periods of volatility and negative returns, real stock market returns over the past 25 years have been positive and in line with long-term historical averages. Image: Deutsche Bank
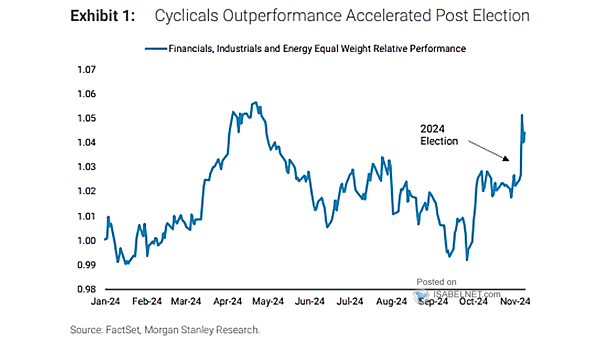
Performance – Cyclicals Outperformance Following the election, U.S. cyclical stocks have significantly outperformed, reflecting investor optimism about the new administration’s pro-growth policies and economic resilience. Image: Morgan Stanley Research
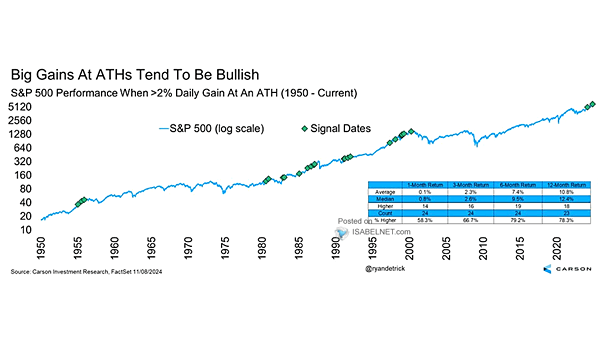
S&P 500 Performance When >2% Daily Gain at an All-Time High Since 1950, the S&P 500 index has demonstrated robust performance in the year following a daily gain of over 2% at an all-time high, with a median increase of 12.4%. Image: Carson Investment Research