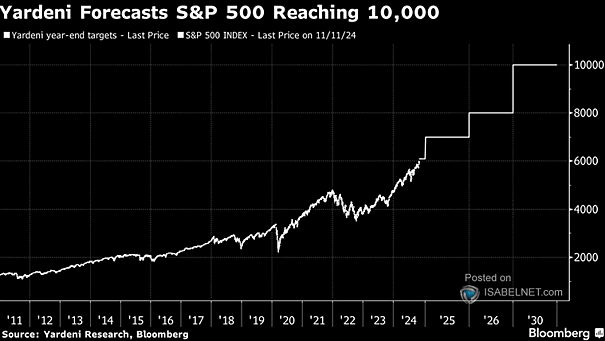
U.S. Firms Responses to Whether They Use AI to Produce Goods and Services

U.S. Firms Responses to Whether They Use AI to Produce Goods and Services Currently, only 5% of U.S. firms use AI to produce goods and services, but this figure is expected to grow as more companies recognize the potential benefits of AI technologies. Image: BofA US Equity & Quant Strategy

1-Day Post-Reporting Performance vs. S&P 500 on EPS and Sales Surprise

1-Day Post-Reporting Performance vs. S&P 500 on EPS and Sales Surprise Companies that exceeded both sales and EPS expectations outperformed the S&P 500 by 2.4ppt the following day, which is the strongest performance since 4Q2018 and considerably higher than the historical average of 1.5ppt. Image: BofA US Equity & Quant Strategy

Percentage of S&P 500 Earnings by Sector

Percentage of S&P 500 Earnings by Sector This week is a crucial one for S&P 500 earnings, with several key events and releases that could significantly impact the market. Image: BofA US Equity & Quant Strategy

S&P 500 Seasonality Since 1928

S&P 500 Seasonality Since 1928 The seasonal trends observed since 1928 indicate a pattern where July and August typically see positive stock performance, followed by a dip in late summer and a rally into the year-end. Image: BofA Global Research

Sentiment Scores During Earnings Calls

Sentiment Scores During Earnings Calls In recent quarters, falling inflation and the prospect of lower interest rates have had a positive impact on U.S. corporate sentiment, which is seen as a favorable sign for the U.S. economy. Image: BofA US Equity & Quant Strategy

Contributions to U.S. GDP Growth

Contributions to U.S. GDP Growth Goldman Sachs predicts a 2.2% Q4/Q4 expansion in U.S. GDP for 2024, surpassing consensus estimates and highlighting the economy’s resilience. Image: Goldman Sachs Global Investment Research

S&P 500 Monthly Returns During an U.S. Election Year

S&P 500 Monthly Returns During an U.S. Election Year The S&P 500 has historically performed well in August during presidential election years, contributing to an overall positive market sentiment and potentially extending the summer rally. Image: Carson Investment Research

U.S. Small Cap Stocks vs. U.S. Large Cap Stocks

U.S. Small Cap Stocks vs. U.S. Large Cap Stocks U.S. small caps are currently viewed as an attractive investment opportunity compared to U.S. large caps, with several factors suggesting potential outperformance over the next decade. Image: BofA Global Research

Investment Grade (IG) Spread

Investment Grade (IG) Spread According to Goldman Sachs, Investment Grade (IG) spreads are expected to remain virtually unchanged over the next 12 months. Image: Goldman Sachs Global Investment Research

S&P 500 and Chicago Fed National Financial Conditions Index

S&P 500 and Chicago Fed National Financial Conditions Index Should investors stay optimistic? The rise in the Chicago Fed Financial Conditions Index is seen as a bullish signal for the S&P 500, suggesting potential for further upside. Image: BofA Global Research

S&P 500 Index and Earnings per Share

S&P 500 Index and Earnings per Share Corporate earnings are the cornerstone of equity prices. Deutsche Bank’s positive forecast for the S&P 500 index reflects a general belief in the strength of these earnings. Image: Yahoo Finance