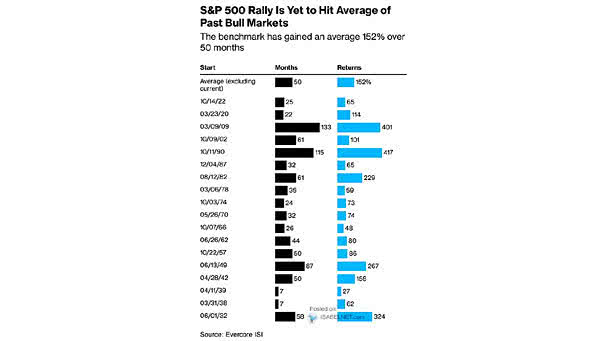
Global Composite PMI and EPS Growth

Global Composite PMI and EPS Growth The Global Composite PMI serves as a leading indicator for EPS growth, with its trends providing insights into future corporate earnings performance. Image: J.P. Morgan

VIX vs. S&P 500

VIX vs. S&P 500 The lack of a significant increase in the VIX during the market decline may indicate that widespread panic selling is absent. Image: Real Investment Advice

10-Year/2-Year Treasury Yield Curve Around First Fed Rate Cuts

10-Year/2-Year Treasury Yield Curve Around First Fed Rate Cuts The U.S. yield curve typically steepens once the prospect of interest rate cuts by the Fed becomes more imminent, rather than when the Fed actually stops hiking rates. Image: Goldman Sachs Global Investment Research

Flows – Net Buys 4-Week Average and S&P 500

Flows – Net Buys 4-Week Average and S&P 500 Last week, BofA’s clients were significant net sellers of U.S. equities, unloading approximately $7 billion worth of stocks. Image: BofA Securities

Market – Current Pricing of Policy, Political and Macro Outcomes

Market – Current Pricing of Policy, Political and Macro Outcomes Investors are confidently predicting a 100% chance of a Fed rate cut on September 18, a 75% likelihood of Donald Trump winning the U.S. election on November 5, and a 68% probability of a soft landing within the next 12 months. Image: BofA Global Investment…

Performance – Large Cap Growth vs. Small Cap Value

Performance – Large Cap Growth vs. Small Cap Value Large-cap growth stocks are outperforming small-cap value stocks at a level not seen since the dot-com bubble era. Historical patterns and the potential for economic recovery indicate that this trend may change in the long term. Image: BofA Global Investment Strategy

Performance – Ratio of Russell 2000 Index to Nasdaq Composite

Performance – Ratio of Russell 2000 Index to Nasdaq Composite Small-cap stocks are currently at a record low relative to the Nasdaq Composite. Factors that could drive small-cap stocks to outperform include a rise in M&A and IPOs, robust earnings growth, and changes in interest rates. Image: BofA Global Investment Strategy

U.S. GDP Growth

U.S. GDP Growth BofA forecasts a robust U.S. GDP growth of 2.3% quarter-over-quarter (QoQ) seasonally adjusted annual rate (SAAR) in Q2 2024, reflecting the bank’s confidence in the resilience of the American economy. Image: BofA Global Research

Cumulative Global Equity Fund Flows Across Regions

Cumulative Global Equity Fund Flows Across Regions In 2024, U.S. equities have seen notable inflows, indicating a resurgence of investor confidence despite ongoing concerns about valuations. Image: Goldman Sachs Global Investment Research

S&P 500 Performance After >50% of the Components Make a 20-Day High

S&P 500 Performance After >50% of the Components Make a 20-Day High When more than 50% of S&P 500 components hit a 20-day high, the S&P 500 index tends to perform strongly in the following 12 months, with a median increase of 16.4% in value seen a year later since 1972. Image: Carson Investment Research

Cumulative Large Cap vs Small Cap Equity Flows

Cumulative Large Cap vs Small Cap Equity Flows Since 2021, U.S. large-cap funds have seen significantly higher inflows compared to U.S. small-cap funds, highlighting a broader trend of investor preference for larger, established companies. Image: BofA Global Investment Strategy