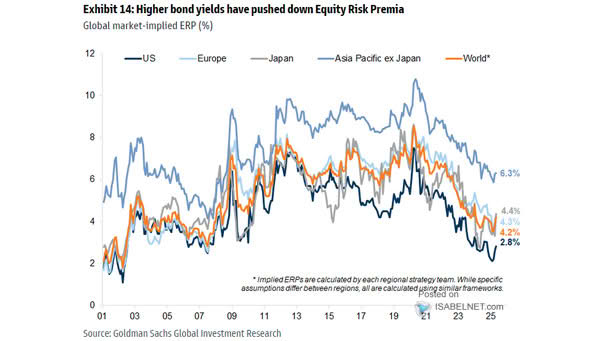
U.S. M2 Money Supply
U.S. M2 Money Supply With M2 up 4.27% year on year, the money supply is lagging behind economic growth, pointing to cooling inflation rather than trouble. Image: Real Investment Advice
Performance Based on Congress Makeup – Average S&P 500 Index Annual Return Since 1950, U.S. stocks have typically shone under a split Congress, posting an average annual gain of 15.1% as investors embrace the political gridlock that keeps sweeping policy changes in check. Image: Carson Investment Research
Markets – Average Daily Change: SPY, TLT, LQD, HYG, IBIT Is “Sell America” becoming the new market mantra? Europe could rattle investors if it strikes back with tariffs and its own trade bazooka. Image: Bloomberg
Bond Fund Flows (Last 4 Weeks) Bond funds keep drawing strong inflows as investors look for yield and stability in a world of moderating inflation and lingering uncertainty. Image: Deutsche Bank Asset Allocation
GS U.S. Financial Conditions Index Lower rates and the end of quantitative tightening have opened the door to easier U.S. financial conditions, paving a smoother path for growth among households and businesses. Image: Goldman Sachs Global Investment Research
Risk Appetite Indicator for Different Asset Classes Investors’ appetite for equities has surged, showing signs of overheating and leaving little margin for error. Image: Goldman Sachs Global Investment Research
Annual Real S&P 500 Index and 3-Year Average Annual Return The S&P 500 sits about 18% above its three‑year average, a strong run by any measure, but past rallies this sharp rarely come without some turbulence ahead. Image: Real Investment Advice
January Barometer and S&P 500 Index Return Rest of Year When U.S. stocks end January in the green, momentum usually keeps rolling. Historically, a positive January has been followed by above-average returns 87% of the time, with a median return of 13.4% over the next 11 months. Image: Carson Investment Research
Valuation – S&P 500 NTM P/E At a forward P/E of 17 versus 22 for the benchmark, the equal-weight index highlights just how tight market leadership has become. Opportunities may lie in the market’s middle ground, where valuations look fairer and risks more contained. Image: Goldman Sachs Global Investment Research
Global Economy – GDP Growth Projections The IMF projects global growth at 3.3% in 2026 and 3.2% in 2027. Strong tech spending, policy support, and private-sector agility are keeping momentum alive despite shifting trade winds. Image: International Monetary Fund
S&P 500 Buybacks S&P 500 buybacks have lost some steam lately, but most analysts view it as a short breather following record highs, not a sign that corporate cash is drying up. Image: Deutsche Bank Asset Allocation