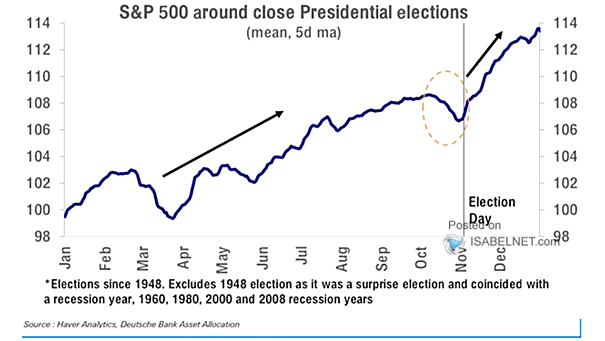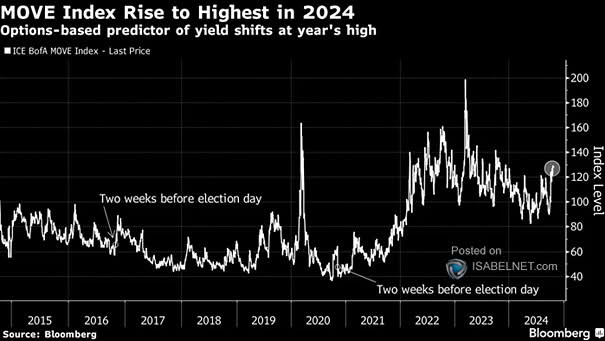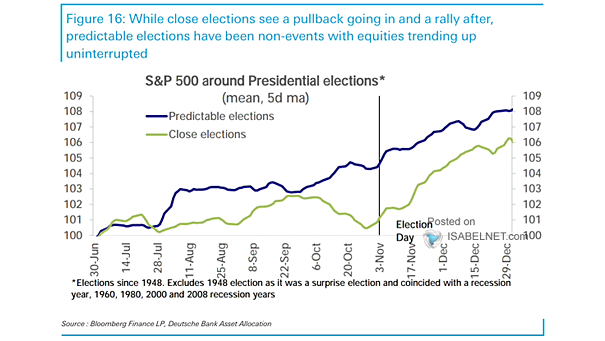
S&P 500 Around Predictable U.S. Presidential Elections
S&P 500 Around Predictable U.S. Presidential Elections While U.S. elections can create anxiety and volatility due to policy uncertainties, predictable elections often coincide with continued market trends and reduced market volatility. Image: Deutsche Bank Asset Allocation