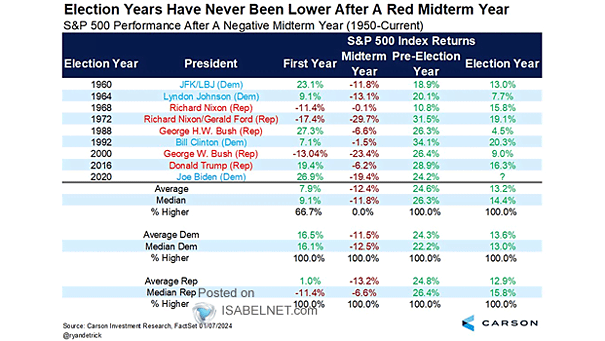
Inflation – U.S. CPI Forecasts

Inflation – U.S. CPI Forecasts With inflation high, the Fed’s interest rate cut decisions require a delicate balance between price stability, economic expansion and employment support. Image: BofA Global Investment Strategy

S&P 500 – Largest 7 Stocks vs. Rest of Index

S&P 500 – Largest 7 Stocks vs. Rest of Index Investing heavily in the largest seven U.S. stocks in a portfolio tends to underperform the rest of the S&P 500 index over the long term, potentially leading to a negative alpha. Image: Ned Davis Research

Valuation – S&P 500 Long-Term P/E Ratio

Valuation – S&P 500 Long-Term P/E Ratio Valuation, particularly in the context of the S&P 500’s long-term P/E ratio, is a significant consideration for investors. The high current ratio suggests potential overvaluation. Image: The Daily Shot

U.S. 2-Year Treasury Yield – Weekly Chart

U.S. 2-Year Treasury Yield – Weekly Chart Technical analysis suggests that the 2-year U.S. Treasury yield is projected to decline by the end of 2024, with a potential target between 3.50% and 3.29%. Image: BofA Global Research

The Five Largest Stocks in the S&P 500

The Five Largest Stocks in the S&P 500 The concentration of the S&P 500 in the 5 largest stocks is higher than it was 60 years ago, which is considered a potential risk, as it may result in increased market volatility and a lack of diversification. Image: Bianco Research

Fed – The Distribution of FOMC Voters

Fed – The Distribution of FOMC Voters Should investors bet for a hawkish Fed policy tone in 2025, as the central bank remains focused on its fight against persistent inflation, even if it means risking some economic pain? Image: BofA Global Research

Global Policy Rate Hikes

Global Policy Rate Hikes In June 2024, for the first time since October 2020, no major central banks around the world raised interest rates, marking a significant shift in global monetary policies. Image: BofA Global Investment Strategy

S&P 500 Index Relative to Historic Valuation Ranges

S&P 500 Index Relative to Historic Valuation Ranges The fact that U.S. markets are trading significantly above their typical valuation levels suggests that the expected outcomes may not be as optimistic as many investors anticipate. Image: Real Investment Advice

U.S. Government Total Outlays

U.S. Government Total Outlays U.S. federal government spending has risen sharply since the 2020s, sparking debates about fiscal responsibility and the long-term implications for the U.S. economy. Image: BofA Global Investment Strategy