Top 10 Stocks as % of S&P 500

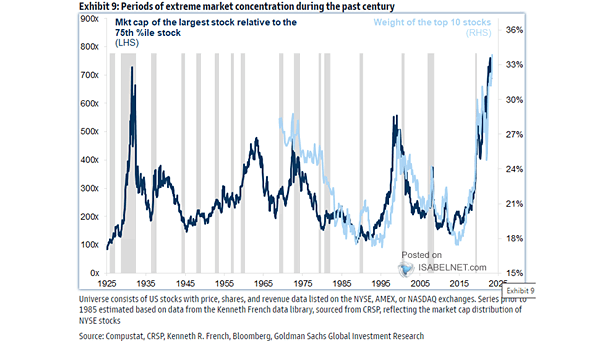
Top 10 Stocks as % of S&P 500 In recent years, there has been a substantial rise in concentration among the top 10 companies in the S&P 500, which has raised concerns about potential risks to investors. Image: Goldman Sachs Global Investment Research
Average S&P 500 Returns by the First and Second Half of the Month

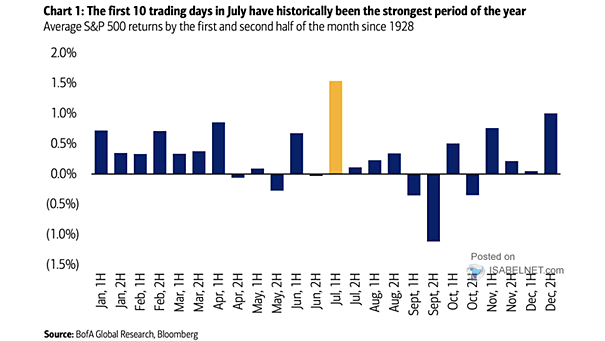
Average S&P 500 Returns by the First and Second Half of the Month Seasonality is a useful statistical tool, but not a crystal ball for predicting future market movements. Past patterns indicate that the U.S. stock market has often demonstrated strength in the first half of July. Image: BofA Global Research

Seasonality Trends in MSCI AC World Index (Global Equities)

Seasonality Trends in MSCI AC World Index (Global Equities) July has historically been a strong month for global equities, offering opportunities for investors to capture potential gains. Image: BofA Global Quantitative Strategy

30 Largest Stocks as a Percentage of S&P 500 Market Capitalization

30 Largest Stocks as a Percentage of S&P 500 Market Capitalization The 30 largest stocks account for 53% of the S&P 500’s total market capitalization, raising concerns about the index’s concentration and potential risks. Image: Morgan Stanley Wealth Management

S&P 500 Returns After 20 or More All-Time Highs at Midpoint of the Year

S&P 500 Returns After 20 or More All-Time Highs at Midpoint of the Year Since 1950, when the S&P 500 index has made 20 or more all-time highs by mid-year, the full year has been positive 100% of the time, with an average of 20 new all-time highs in the second half. Image: Carson Investment…

U.S. Dollar to Japanese Yen (USD/JPY)

U.S. Dollar to Japanese Yen (USD/JPY) Goldman Sachs has updated its projections for the USD/JPY exchange rate, anticipating the US dollar to reach 155 yen in three months, 155 yen in six months, and 150 yen in 12 months. Image: Goldman Sachs Global Investment Research

S&P 500 Returns After >10% YTD at the Middle of the Year

S&P 500 Returns After >10% YTD at the Middle of the Year Since 1950, when the S&P 500 index has been up more than 10% at the middle of the year, the full year has been positive 100% of the time with a median gain of 26.4%. Image: Carson Investment Research

Where Do You See S&P 500 at Year End?

Where Do You See S&P 500 at Year End? Just 4.7% of JPM clients hold high expectations for the S&P 500 index, believing that it will surpass 6,000 by the end of 2024. This indicates a significant level of optimism regarding the future performance of the stock market. Image: J.P. Morgan

Returns for Major Global Financial Assets

Returns for Major Global Financial Assets Over the past 50 years, the annualized equity returns in the U.S., adjusted for inflation, have been around 7.5%. This solid long-term performance has allowed investors to achieve significant growth, outpacing the rate of inflation. Image: Deutsche Bank