FMS Investors – Biggest “Tail Risk”
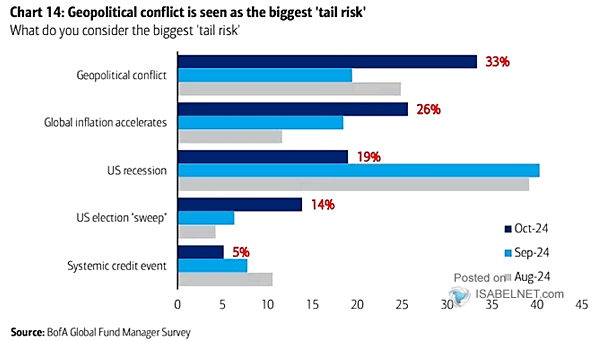
FMS Investors – Biggest “Tail Risk” Concerns about geopolitical conflict have risen among FMS investors, with 33% now viewing it as the biggest “tail risk” for the global economy, primarily due to its potential negative impact on financial markets and investments. Image: BofA Global Fund Manager Survey