S&P 500 Daily Chart
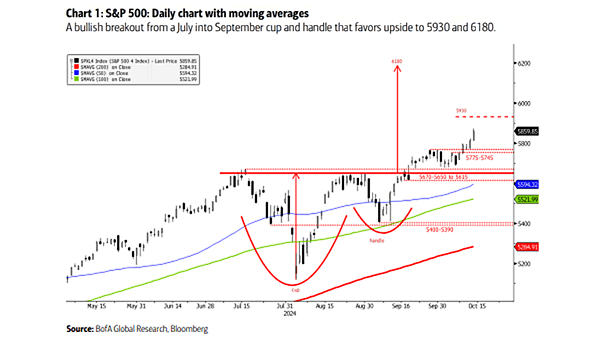
S&P 500 Daily Chart The cup and handle breakout suggests a bullish trend, implying that the S&P 500 index could experience upward movement, with target levels of 5930 and 6180. Image: BofA Global Research
S&P 500 Daily Chart The cup and handle breakout suggests a bullish trend, implying that the S&P 500 index could experience upward movement, with target levels of 5930 and 6180. Image: BofA Global Research
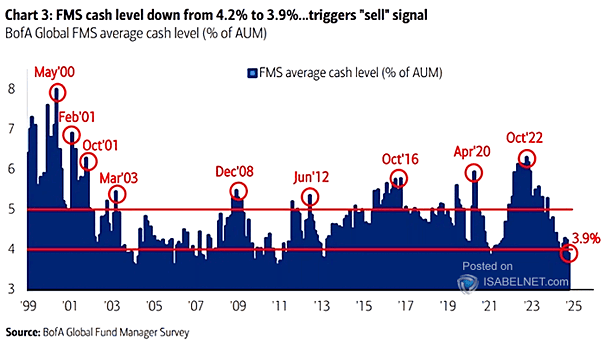
FMS Average Cash Balance The FMS cash level’s recent decline to 3.9% has generated a contrarian sell signal for global equities. Historically, these signals often precede market corrections, prompting investors to reassess their strategies. Image: BofA Global Fund Manager Survey
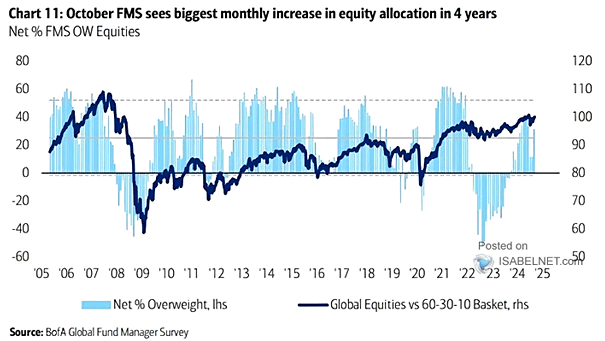
Equities – FMS Global Equity Allocation FMS investors significantly increased their equity allocation in October, the largest rise since June 2020. This shift is primarily due to a favorable economic climate resulting from the easing of monetary policies by major central banks. Image: BofA Global Fund Manager Survey
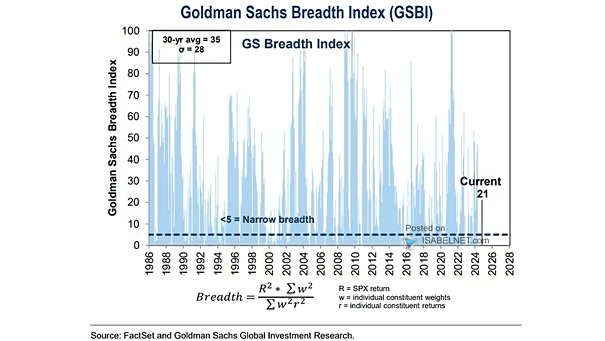
Market – Breadth Index With the Goldman Sachs Breadth Index at 21, it remains below the 30-year average of 35, indicating that fewer stocks are contributing to market gains. Image: Goldman Sachs Global Investment Research
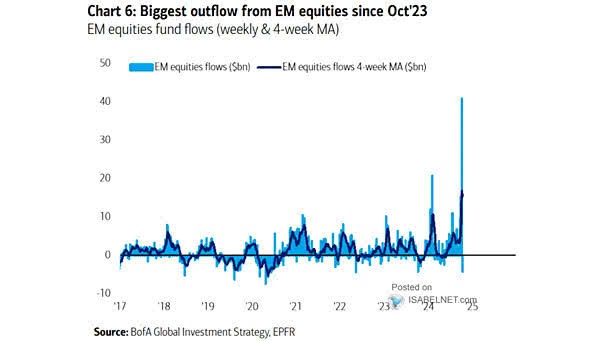
Emerging Market Equity Flows Emerging market equity funds have seen substantial outflows, highlighting the fragility of market sentiment amidst ongoing economic challenges. Image: BofA Global Investment Strategy
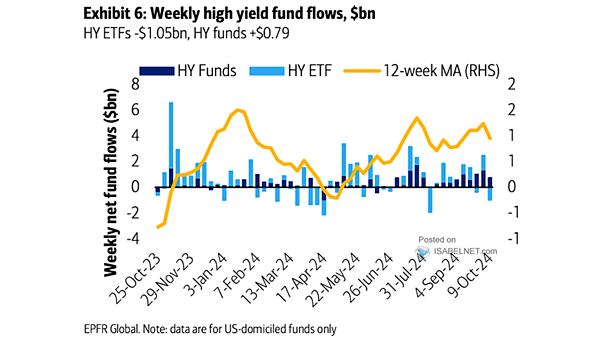
Weekly High Yield Fund Flows Over the past week, U.S. high-yield funds experienced their largest outflow in nine weeks, signaling a shift in investor sentiment towards lower-risk assets. Image: BofA Global Research
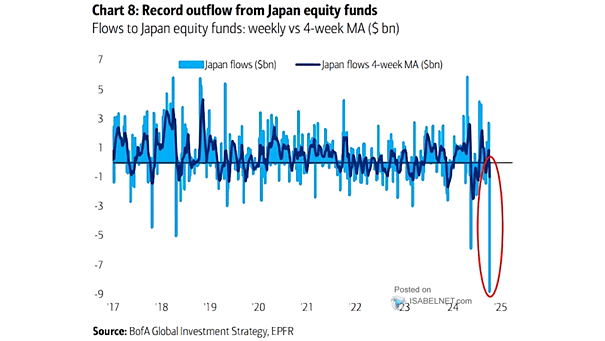
Flows to Japan Equities While Japanese equities have faced significant outflows recently due to shifting investor sentiment, underlying structural reforms and an evolving economic landscape may provide opportunities for recovery in the future. Image: BofA Global Investment Strategy
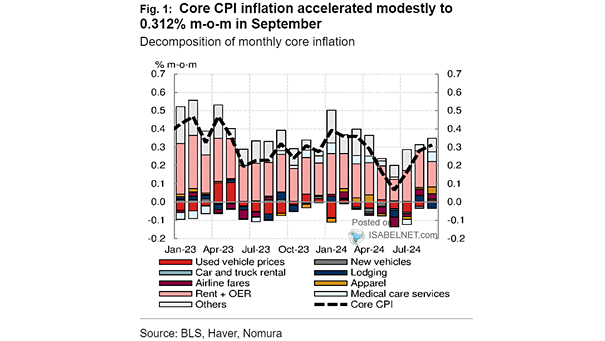
U.S. Core CPI Inflation In September, U.S. core CPI inflation showed a modest increase of 0.312% month-over-month, indicating that inflation pressures are not significantly escalating. Image: Nomura
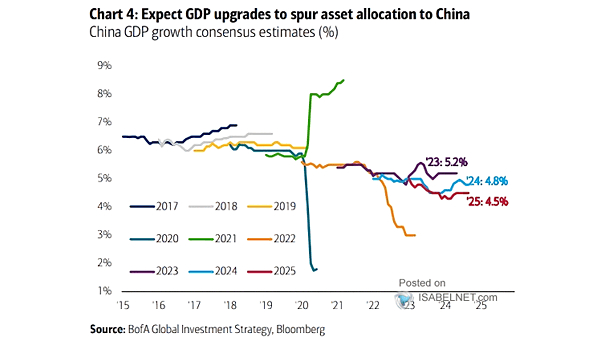
China GDP Growth Consensus Estimates GDP upgrades are likely to spur interest in China’s markets, encouraging asset allocation towards sectors that align with the country’s economic transformation. Image: BofA Global Investment Strategy
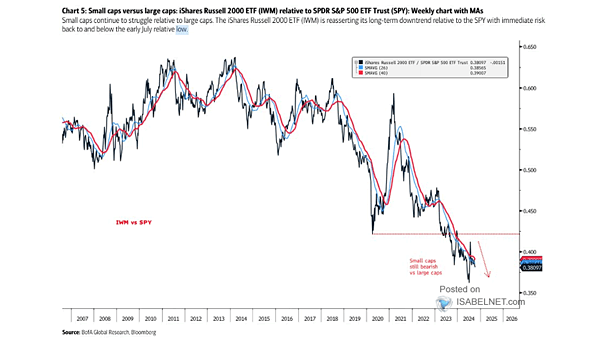
Performance – U.S. Small Cap Stocks vs. Large Cap Stocks Small caps continue to face significant challenges relative to large caps, a trend that has persisted for several years. However, there is a growing sense of cautious optimism about their potential recovery as market conditions change. Image: BofA Global Research
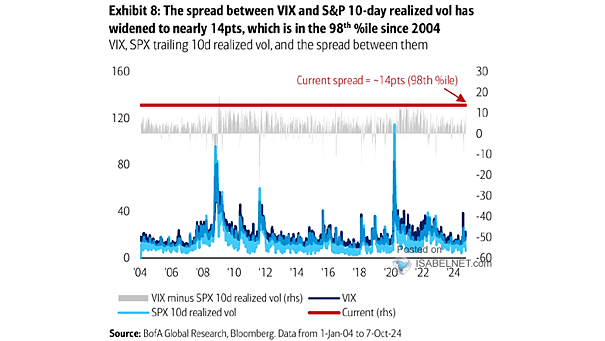
VIX Index and S&P 500 Realized Volatility The spread between the VIX and the S&P 10-day realized volatility, when in the 98th percentile, may signal a potential opportunity for U.S. stocks to rally towards the end of the year. Image: BofA Global Research