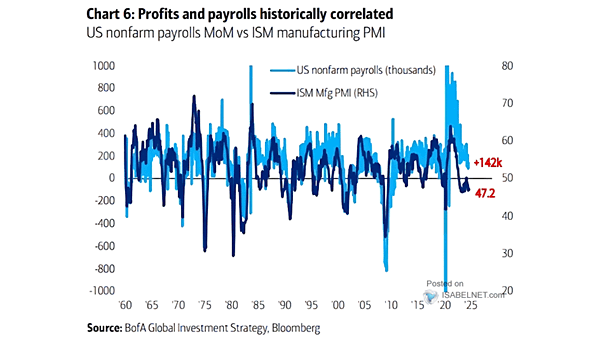
S&P 500 vs. S&P 500 Equal-Weight

S&P 500 vs. S&P 500 Equal-Weight The S&P 500 cap-weighted index return premium has reached extreme levels. Should investors now favor the S&P 500 equal-weighted index over the cap-weighted index? Image: Morgan Stanley Wealth Management

U.S. Tech Valuations – Forward P/E Ratio

U.S. Tech Valuations – Forward PE Ratio U.S. tech sector’s valuations have surpassed post-COVID highs. However, historical precedent suggests that these high valuations may be challenging to sustain going forward. Image: Morgan Stanley Wealth Management

S&P 500 Price Target

S&P 500 Price Target Citing robust corporate earnings, Deutsche Bank has set a year-end 2024 target of 5,500 for the S&P 500 index. Image: Deutsche Bank

S&P 500 Performance After New All-Time Highs On All Five Days of the Week

S&P 500 Performance After New All-Time Highs On All Five Days of the Week When the S&P 500 hits new all-time highs on all five days of the week, historical data suggests a bullish outlook over the next 12 months, with a median return of 8.7% since 1950. Image: Carson Investment Research

MSCI World Value vs. Growth

MSCI World Value vs. Growth Given the current market dynamics, will the outperformance of growth stocks over value stocks be reversed in the future, with value stocks potentially taking the lead? Image: Goldman Sachs Global Investment Research

U.S. 10-Year Treasury Yield

U.S. 10-Year Treasury Yield The 10-year U.S. Treasury yield has been in a secular bear market since February 2022, and it could potentially approach 6% in the coming years. Image: BofA Global Research

Real S&P 500 vs. Valuations (CAPE)

Real S&P 500 vs. Valuations (CAPE) The timing of your investment journey can significantly impact your future outcomes. Even with the Fed’s interventions, recovering from a bear market can take an extended period after speculative “booms.” Image: Real Investment Advice

ISM Manufacturing PMI and Global Stocks vs. Government Bonds

ISM Manufacturing PMI and Global Stocks vs. Government Bonds In a potential shift from a “no” to a “hard” landing scenario, government bonds may outperform due to increased risk aversion, interest rate cuts, lower inflation expectations, and their historical performance during economic downturns. Image: BofA Global Investment Strategy

Performance – S&P 500 vs. S&P Regional Banks Index

Performance – S&P Regional Banks Index vs. S&P 500 Regional banks and the equal-weighted S&P 500 have recently reached new relative lows, a concerning trend in the financial market. This trend is noteworthy given the recent S&P 500 performance. Image: Morgan Stanley Research