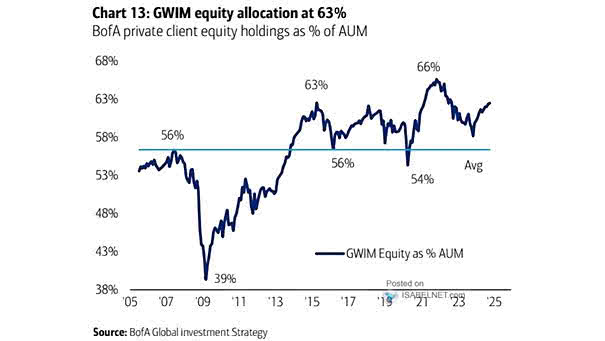
U.S. ISM Manufacturing and Services Survey Data

U.S. ISM Manufacturing and Services Survey Data A “soft recession” occurs when the manufacturing side of the U.S. economy contracts while services remain robust, leading to a period of slower economic activity. Image: Real Investment Advice

Performance of Different U.S. Fama French Factor Returns

Performance of Different U.S. Fama French Factor Returns U.S. small-cap value has been the best bet over the past 25 years. However, small-cap value stocks are typically more volatile in the short term, making a long-term investment strategy necessary. Image: BofA Research Investment Committee

Price of Oil Forecast

Price of Oil Forecast In contrast to futures market’s expectations, Goldman Sachs forecasts a positive outlook for oil prices over the next 3 months. Image: Goldman Sachs Global Investment Research

Utilities Flows

Utilities Flows Utility funds continue to attract strong inflows, making them a popular choice for investors seeking stable and predictable returns. Image: BofA Global Investment Strategy

India Equity Fund Flows

India Equity Fund Flows Investor behavior and sentiment are frequently gauged by analyzing fund flows. Over the past week, India equity funds experienced record inflows, indicating a surge in optimism among investors. Image: BofA Global Investment Strategy

S&P 500 3-Month Performance During an Election Year

S&P 500 3-Month Performance During an Election Year In Presidential election years, June to August stands out as the strongest 3-month period of the year. The S&P 500 has been up 75% of the time, with an average return of 7.3% since 1928. Image: Carson Investment Research

Market – Geographical Breakdown of MSCI World Index Constituents

Market – Geographical Breakdown of MSCI World Index Constituents The combined market capitalization of the Magnificent Seven would make it the second-largest country stock exchange globally. This would surpass the total value of many thriving economies. Image: BofA Global Research

Decomposition of S&P 500 Total Returns

Decomposition of S&P 500 Total Returns According to BofA, dividends are expected to play a larger role in S&P 500’s total returns in the future than they have over the past decade. Image: BofA US Equity & Quant Strategy

S&P 500 Performance One Year After >4% Monthly Gains

S&P 500 Performance One Year After >4% Monthly Gains Since 1950, the S&P 500 has never been lower a year after a monthly gain of over 4% in May. This period has been particularly profitable for investors, with an average gain of 20.1%. Image: Carson Investment Research

The U.S. Dollar As A Reserve Currency

The U.S. Dollar As A Reserve Currency While the U.S. dollar’s status as the world’s reserve currency may evolve and share influence with other currencies, it is expected to remain a dominant currency for the foreseeable future. Image: BofA Global Research

S&P 500 Returns After >10% YTD End of May

S&P 500 Returns After >10% YTD End of May Bulls smile when the S&P 500 index has gained more than 10% after the first five months of the year, as the average return for the rest of the year has been 8.8% since 1950. Image: Carson Investment Research