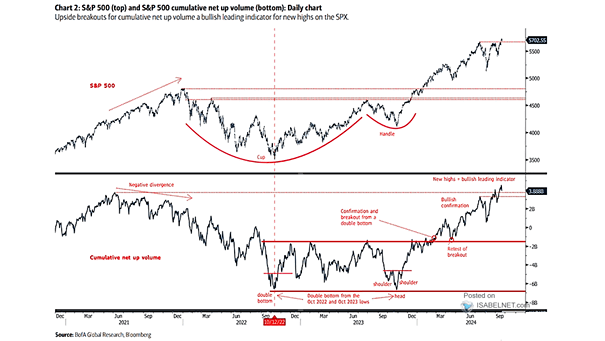
Risk Appetite Index

Risk Appetite Index As investors embrace a more aggressive stance, the risk appetite indicator is back to elevated levels, signaling a willingness to take on higher levels of risk for potentially greater returns. Image: Goldman Sachs Global Investment Research

Valuation – S&P 500 12-Month Forward P/E

Valuation – S&P 500 12-Month Forward P/E With a forward P/E of 21, the S&P 500’s current valuation is in the 90th percentile compared to the past 100 years. While high valuations may not immediately affect stock prices, they can impact them when market conditions shift. Image: Morgan Stanley Wealth Management

Nasdaq 100 vs. Commodities

Nasdaq 100 vs. Commodities Will commodities outperform U.S. tech going forward? Image: BofA Global Investment Strategy

Materials Flows

Materials Flows Fund flows are widely regarded as an indicator of investor behavior and sentiment. Strong weekly inflows in materials suggest optimistic investor interest and confidence. Image: BofA Global Investment Strategy

Inflation Assets and Deflation Assets

Inflation Assets and Deflation Assets In order to mitigate inflation risks, should investors increase their allocation to inflation assets and decrease their exposure to deflation assets in their portfolio? Image: BofA Global Investment Strategy

Seasonality – S&P 500 Index Returns in May

Seasonality – S&P 500 Index Returns in May The middle of May is historically a period of weakness for U.S. stocks, while the end of May typically exhibits strength. Image: Carson Investment Research

When Will the Fed First Cut Interest Rates?

When Will the Fed First Cut Interest Rates? Will the Fed lower interest rates in the second quarter of 2024? This decision holds significant implications for financial markets and the economy. Image: BofA Global Fund Manager Survey

Net Buys by Size Segment

Net Buys by Size Segment Bofa’s clients maintain their preference for large-caps, while showing less interest in small-caps and mid-caps. Image: BofA Securities

S&P 500 Valuation – Real Market Capitalization to Real GDP Ratio

S&P 500 Valuation – Real Market Capitalization to Real GDP Ratio The inflation-adjusted market capitalization to GDP ratio is a valuable tool to evaluate the U.S. stock market’s valuation. The high current ratio implies a potential overvaluation. Image: Real Investment Advice

Earnings – S&P 500 LTM EPS Growth YoY

Earnings – S&P 500 LTM EPS Growth YoY According to Morgan Stanley’s leading earnings indicator, the outlook for S&P 500 EPS over the next 12 months is positive, suggesting a potential rise in profitability. Image: Morgan Stanley Research