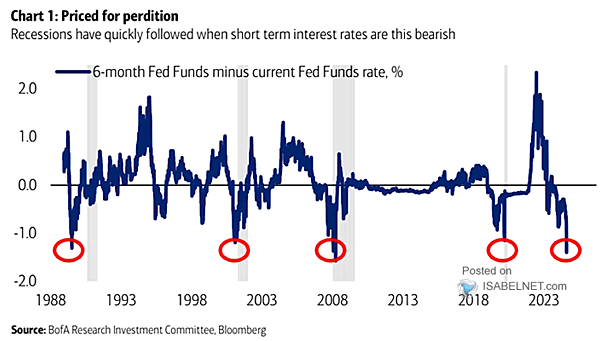
Valuation – S&P 500 Next-Twelve-Month P/E Ratio

Valuation – S&P 500 Next-Twelve-Month P/E Ratio The S&P 500 NTM P/E ratio is currently at a high level of 20.9, indicating that investors are willing to pay a relatively high price for each dollar of expected earnings in the next twelve months. Image: Goldman Sachs Global Investment Research

Dow Jones Industrial Average Weekly Chart with Moving Averages

Dow Jones Industrial Average Weekly Chart with Moving Averages The technical analysis suggests that the Dow Jones may potentially surpass the 42,600 mark in the near term, with the possibility of further gains towards the 45,200 level. Image: BofA Global Research

U.S. Equities Adjusted for Inflation

U.S. Equities Adjusted for Inflation When considering U.S. equity returns adjusted for inflation, currently none of the major indices have surpassed their 2021 highs. Image: Morgan Stanley Research

S&P 500 vs. MOVE Index

S&P 500 Equal Weighted vs. MOVE Index Assuming bond volatility continues to decline, will the S&P 500 equal weighted index continue to rise? Image: Deutsche Bank Asset Allocation

S&P 500 Index vs. U.S. Citi Economic Surprise Index

S&P 500 Index vs. U.S. Citi Economic Surprise Index The S&P 500 Index and the U.S. Citi Economic Surprise Index are often closely correlated. But right now, bad news is good news, until it’s not. Image: Morgan Stanley Wealth Management

S&P 500 Performance After Bear (and Near Bear) Markets End

S&P 500 Performance After Bear (and Near Bear) Markets End Historically, the S&P 500 has consistently rebounded and performed strongly after bear markets. It has consistently delivered positive returns in the first and second year of new bull markets since World War II. Image: Carson Investment Research

Infrastructure Flows

Infrastructure Flows Infrastructure funds have seen their largest inflow since June 2022, signaling a positive trend for investors aiming for long-term returns and portfolio diversification. Image: BofA Global Investment Strategy

Cumulative Gold Flows

YTD Cumulative Gold Flows Despite the upward trajectory of gold prices, the trend of outflows from gold ETFs has persisted. However, bullion and coin purchases have surpassed gold ETF sales and central bank gold purchases since Q3 2020. Image: J.P. Morgan

Valuation – Russell 2000 Forward P/E

Valuation – Russell 2000 Forward P/E The April sell-off has brought the U.S. small-cap forward P/E ratio back below the historical average, suggesting a potential undervaluation of small-cap stocks and creating buying opportunities for long-term investors. Image: BofA US Equity & Quant Strategy

U.S. 30-Year Government Bond Returns

U.S. 30-Year Government Bond Returns The 30-year U.S. Treasury bond is currently experiencing a challenging period in terms of its annual return, as it is on track for the 3rd worst annual return since 1919. Image: BofA Global Investment Strategy