Weekly Energy Flows
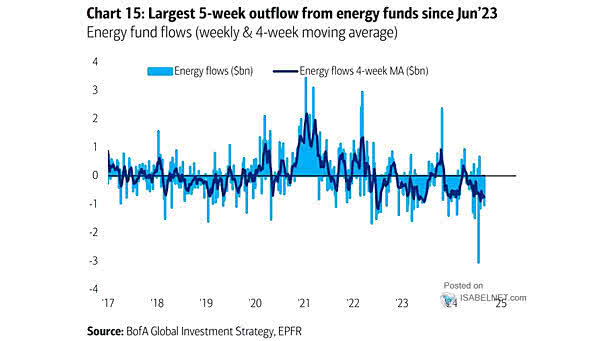
Weekly Energy Flows Energy funds are facing substantial outflows, driven by investor concerns over growth and policy uncertainties. Image: BofA Global Investment Strategy
Weekly Energy Flows Energy funds are facing substantial outflows, driven by investor concerns over growth and policy uncertainties. Image: BofA Global Investment Strategy
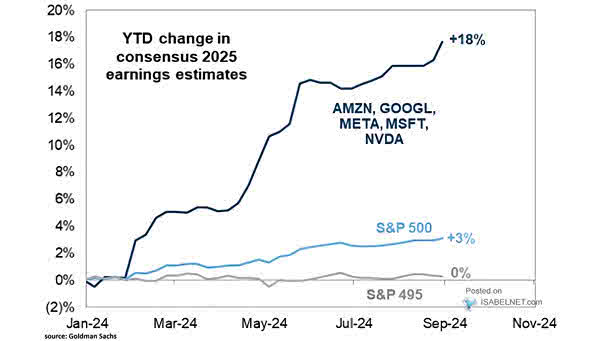
S&P 500 Earnings Estimates The Magnificent Five are positioned for strong earnings growth through 2025, driven by superior sales growth, robust profit margins, and reasonable valuations relative to their growth potential. Image: Goldman Sachs Global Investment Research

S&P 500 Days Sales of Inventory The trough of the inventory de-stocking cycle often coincides with the beginning of a broader business recovery, characterized by rising demand, improved economic conditions, and increased production and sales. Image: BofA Global Research
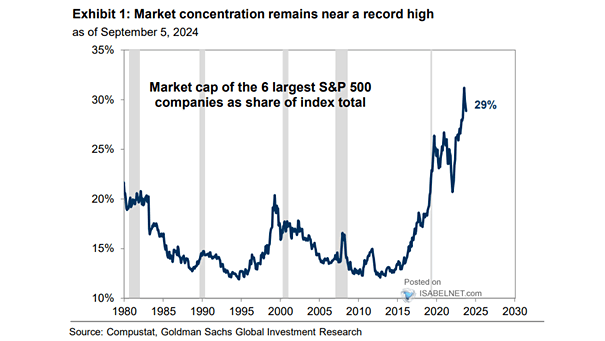
Market Capitalization of Six Largest Companies as Share of S&P 500 Total With the six largest companies accounting for 29% of the S&P 500’s total market capitalization, discussions about diversification have become increasingly relevant. A well-diversified portfolio is vital for effective risk management. Image: Goldman Sachs Global Investment Research
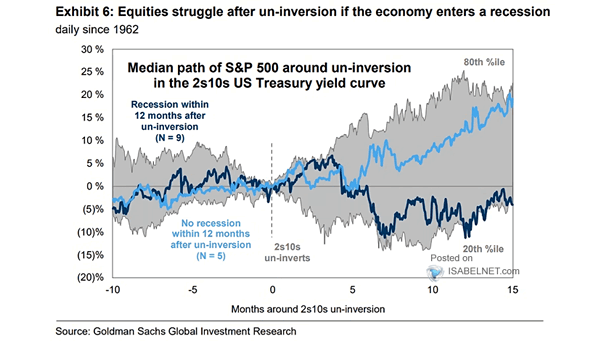
Median Path of S&P 500 Around Un-Inversion in the 2s10s U.S. Treasury Yield Curve An un-inversion in the 2s10s U.S. Treasury yield curve can suggest a positive outlook for U.S. stocks, if a recession is avoided. Image: Goldman Sachs Global Investment Research
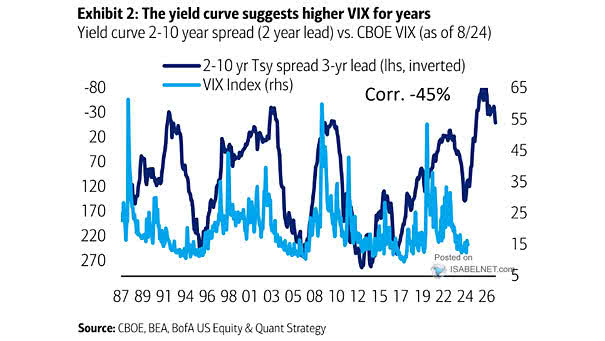
Yield Curve vs. VIX (Leading Indicator) Should U.S. equity investors anticipate increased volatility ahead, given that the yield curve typically leads the VIX by three years? Image: BofA US Equity & Quant Strategy
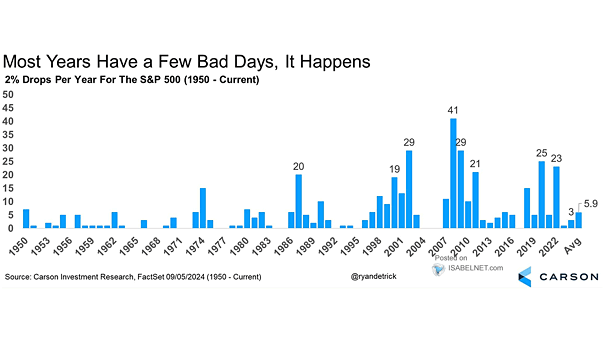
Number of 2% Drops per Year for the S&P 500 Index Though they can be uncomfortable, big drops in the U.S. stock market are relatively common, even in the best years. On average, the S&P 500 sees more than five drops of 2% or more each year. Image: Carson Investment Research
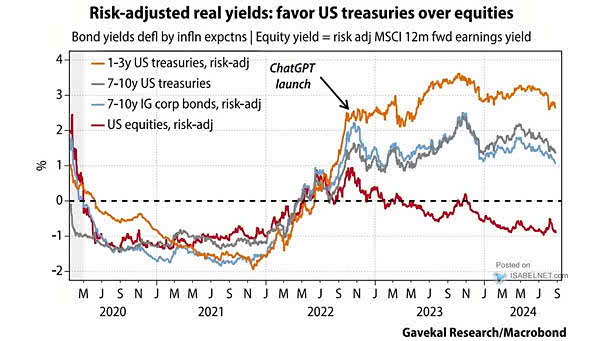
Equities vs. Bonds Recent trends suggest that the risk/reward profile of bonds, particularly U.S. Treasuries, has become more favorable compared to equities. Image: Gavekal, Macrobond
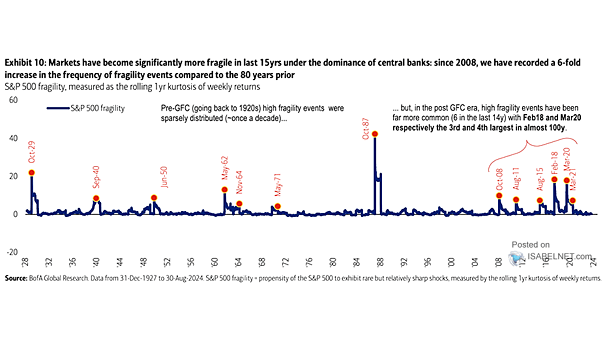
S&P 500 Fragility Following the Global Financial Crisis, high fragility events have become more common, posing risks to U.S. equity investors and undermining the stability of the financial system. Image: BofA Global Research
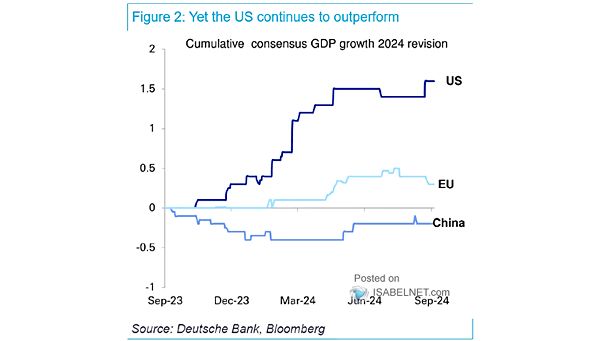
GDP Growth Revision The U.S. economy demonstrates resilience and promising growth outlook, in contrast to the EU and China, which face slower recoveries and economic challenges. Image: Deutsche Bank
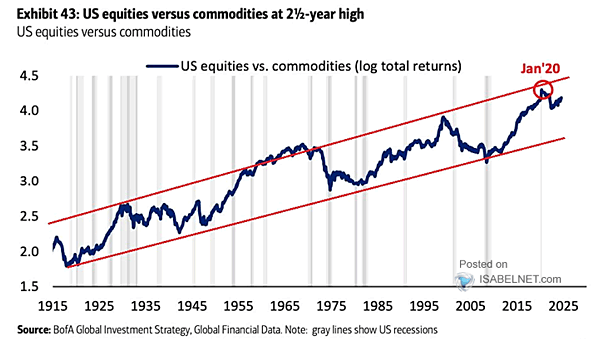
Returns – U.S. Equities vs. Commodities While commodities can serve as a hedge in certain market conditions, U.S. equities are likely to continue outperforming them over the long term due to their lower volatility, more stable returns, and historical performance trends. Image: BofA Global Investment Strategy