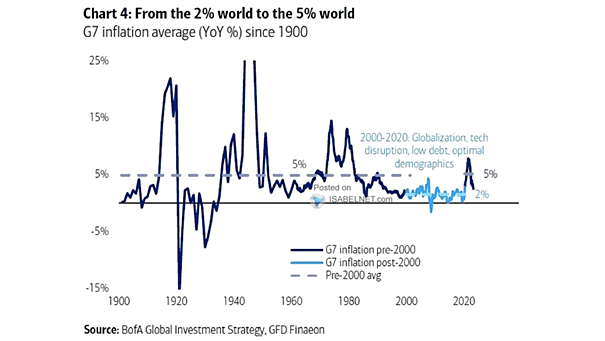
Median S&P 500 Performance

Median S&P 500 Performance Since 2000, the median S&P 500 performance after 6 consecutive declines has been 8.9% over the next 6 months, indicating a potential for a significant rebound and recovery in the stock market. Image: Deutsche Bank

U.S. Nominal GDP

U.S. Nominal GDP The strength of U.S. nominal GDP has been crucially supported by fiscal and monetary policies, along with other contributing factors. Image: BofA Global Investment Strategy

U.S. Economy

U.S. Economy A recent Deutsche Bank survey found that 45% of participants predict a “no-landing” scenario for the U.S. economy by the end of 2024. This suggests no recession and inflation will remain above the Fed’s 2% target. Image: Deutsche Bank

Russell 2000 Forward P/E vs. Subsequent 10-Year Annualized Returns

Russell 2000 Forward P/E vs. Subsequent 10-Year Annualized Returns Should long-term investors increase their allocation to U.S. small-cap stocks, given the potential for 9% annualized ten-year returns suggested by the absolute forward P/E for the Russell 2000? Image: BofA US Equity & Quant Strategy

Bitcoin vs. Gold

Bitcoin vs. Gold Bitcoin’s current price shares similarities with the price of gold in the 1970s. Image: Alpine Macro

Bar & Coin Demand and Real Gold Price

Bar & Coin Demand and Real Gold Price As the gold price rises in real terms, bar and coin buying tends to rise, with inflation fears and economic clouds fueling the rush. Image: Deutsche Bank

S&P 500 and the Percentage of Stocks Above 10-Day MAs

S&P 500 and the Percentage of Stocks Above 10-Day MAs The rise in the percentage of S&P 500 stocks above their 10-day moving averages can be interpreted as a tactical bullish divergence, providing valuable insights into market strength and the potential for a reversal. Image: BofA Global Research

U.S. CPI Inflation

U.S. CPI Inflation The BofA Credit Manager Survey indicates that 50% of respondents expect balanced U.S. inflation risks for the remainder of 2024, which can have implications for investment and risk management strategies in the coming months. Image: BofA US Creditor Investor Survey

High-Yield Bonds vs. 200-Day Moving Average

High-Yield Bonds vs. 200-Day Moving Average In search of higher returns, investors have been pursuing riskier investments through high yield bonds. While this strategy can be rewarding, it also exposes them to increased vulnerability if market conditions worsen. Image: BofA Global Investment Strategy

FMS Investors – Net % Expecting Lower Long-Term Rates

FMS Investors – Net % Expecting Lower Long-Term Rates Only 38% of FMS investors expect bond yields to decrease, while the majority anticipate stable or potentially higher bond yields. Image: BofA Global Fund Manager Survey

Stocks – S&P 500 Growth ETF

Stocks – S&P 500 Growth ETF Despite their previous momentum, U.S. growth stocks are currently facing challenges in reaching new highs. Image: BofA Global Investment Strategy