Gold Price vs. S&P 500 Index and Recessions

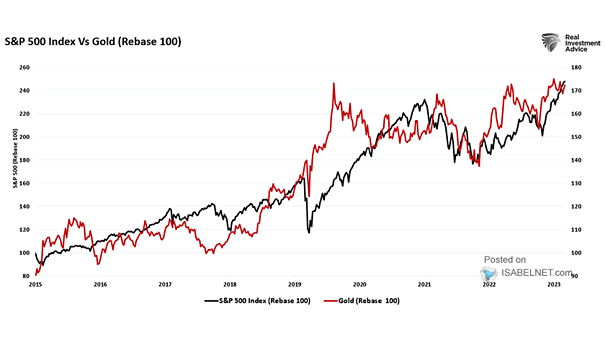
Gold Price vs. S&P 500 Index and Recessions Throughout history, gold has been considered a safe haven during market declines. Since 2015, its correlation with U.S. stocks has strengthened, making it more likely for gold to move in sync with U.S. stocks during market downturns. Image: Real Investment Advice
FMS Investors – Net % Saying Recession Likely

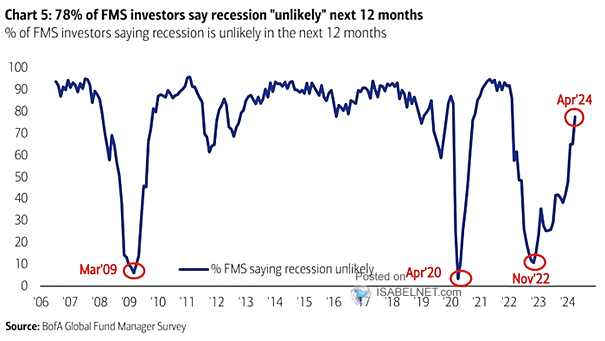
FMS Investors – Net % Saying Recession Likely The outlook among FMS investors regarding the possibility of a global recession in the near future is characterized by a much greater sense of optimism. Image: BofA Global Fund Manager Survey

S&P 500 After Positive YoY 12 Months in a Row

S&P 500 After Positive YoY 12 Months in a Row When the S&P 500 is positive YoY 12 months in a row, the next 12 months tend to be bullish, with a median return of 9.5% since 1950. Image: Carson Investment Research

Commodities – FMS Global Commodity

Commodities – FMS Global Commodity FMS investors have become more optimistic on commodities in April, contributing to a record monthly increase in commodities allocation. Image: BofA Global Fund Manager Survey

FMS Investors – Net % Saying Gold Overvalued

FMS Investors – Net % Saying Gold Overvalued According to FMS investors, gold is currently considered the most overvalued since August 2020, raising concerns about a potential market bubble. Image: BofA Global Fund Manager Survey

Interest Rates – U.S. Federal Funds Rate Expectations

Interest Rates – U.S. Federal Funds Rate Expectations BofA expects a 3.5-3.75% terminal rate in this cutting cycle, up 50bp from their previous forecast. This suggests a need to tighten monetary policy to control inflation and maintain economic balance. Image: BofA Global Research

S&P 500 Index Returns In April

S&P 500 Index Returns In April Since 2000, the second half of April has generally shown strong performance for U.S. stocks. Image: Carson Investment Research

U.S. Long-Term Government Bond Returns

U.S. Long-Term Government Bond Returns The 10-year annualized return from U.S. Treasuries is at a 65-year low of just 0.6%, prompting investors to reassess portfolio allocation and risk management strategies. Image: BofA Global Investment Strategy

Small Cap Stocks vs. Large Cap Stocks Relative Performance

Small Cap Stocks vs. Large Cap Stocks Relative Performance Is it time for U.S. equity investors to increase their allocation to small-cap stocks compared to large-cap stocks in their portfolio? Image: BofA US Equity & Quant Strategy

U.S. ISM Manufacturing PMI vs. S&P 500 EPS Growth

U.S. ISM Manufacturing PMI vs. S&P 500 EPS Growth A rise in the U.S. ISM manufacturing PMI is suggesting positive growth in 1Q EPS, with expectations of outperforming the initial projections. Image: BofA US Equity & Quant Strategy