U.S. Treasury Interest Payments
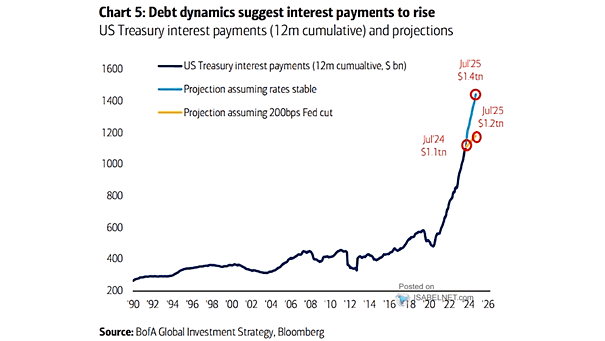
U.S. Treasury Interest Payments The U.S. government’s growing interest payments, driven by rising debt and rates, pose significant risks to the economy and financial markets. Image: BofA Global Investment Strategy
U.S. Treasury Interest Payments The U.S. government’s growing interest payments, driven by rising debt and rates, pose significant risks to the economy and financial markets. Image: BofA Global Investment Strategy
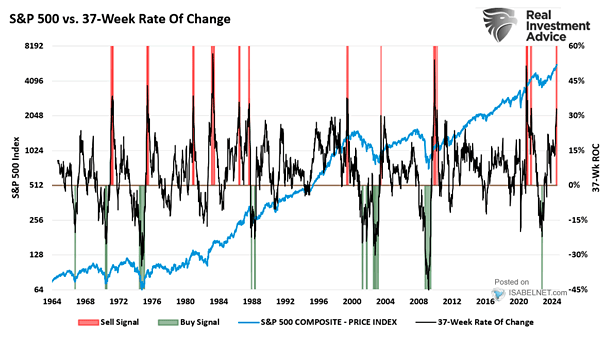
S&P 500 vs. 37-Week Rate of Change Historically, a rise of over 30% in the 37-week rate of change of the S&P 500 Index has served as a warning signal for potential corrections. Image: Real Investment Advice
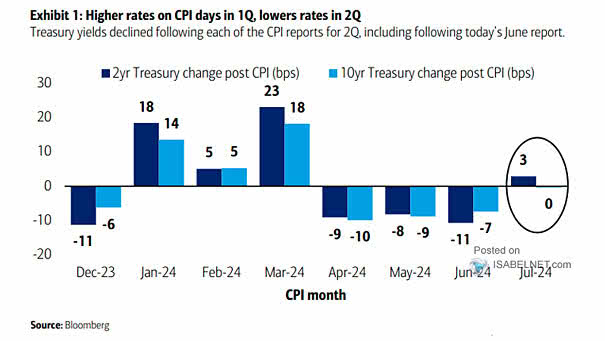
U.S. CPI Inflation vs. U.S. 10-Year Bond Yield CPI dynamics in early 2024 show a clear pattern: Q1’s higher inflation prompted increased Fed scrutiny, while Q2’s declines suggest potential interest rate cuts, impacting market expectations and U.S. Treasury yields on CPI days. Image: BofA Global Research
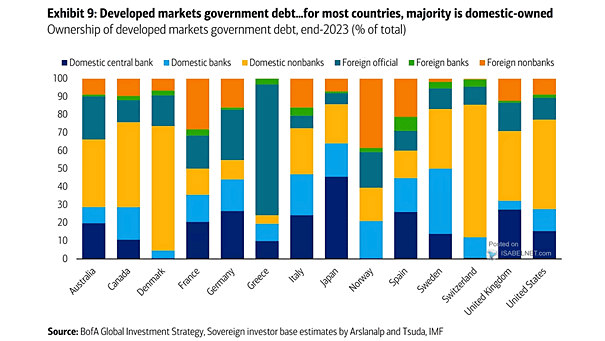
Ownership of Developed Markets Government Debt Most U.S. government debt is owned domestically, while foreign investors hold a smaller but still significant portion. Image: BofA Global Investment Strategy
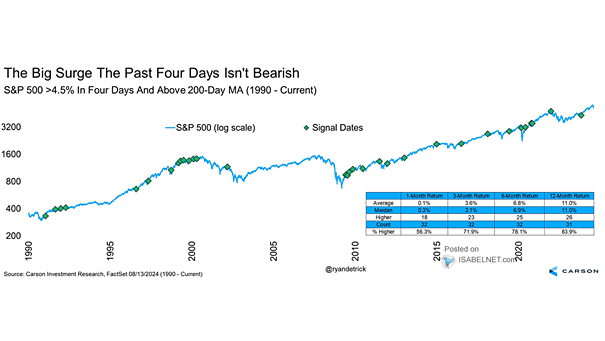
S&P 500 >4.5% in Four Days and Above 200-Day MA Since 1990, when the S&P 500 has risen more than 4.5% in four days, it has shown a strong tendency to be higher a year later, with an average gain of 11%. Image: Carson Investment Research
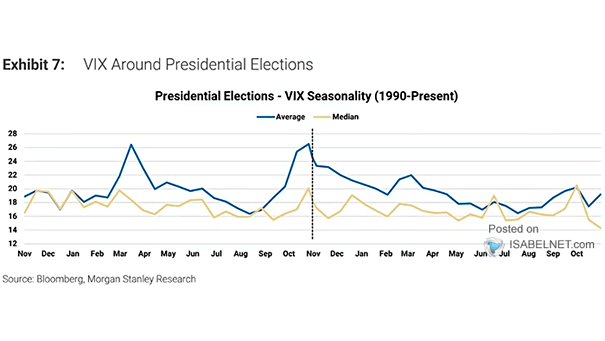
Volatility – VIX and U.S. Election The historical trend of the VIX spiking before U.S. elections and then rapidly declining afterward can be attributed to heightened uncertainty and investor fear in the lead-up to the elections. Image: Morgan Stanley Research
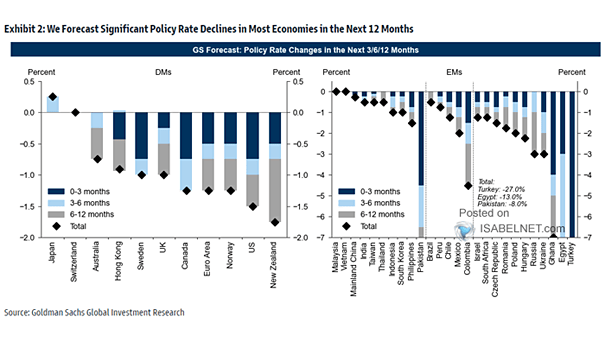
Central Bank Policy Rate Changes Goldman Sachs has revised its forecast regarding interest rate policies, suggesting significant declines in policy rates across most economies over the next 12 months, driven by easing inflation and slowing economic growth. Image: Goldman Sachs Global Investment Research
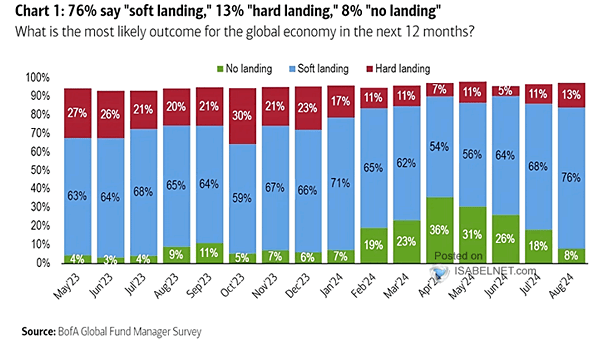
What Is the Most Likely Outcome for the Global Economy in the Next 12 Months? FMS investors are anticipating a “soft landing” as the most likely outcome for the global economy, which implies a gradual and controlled slowdown rather than a sharp or disruptive downturn. Image: BofA Global Fund Manager Survey
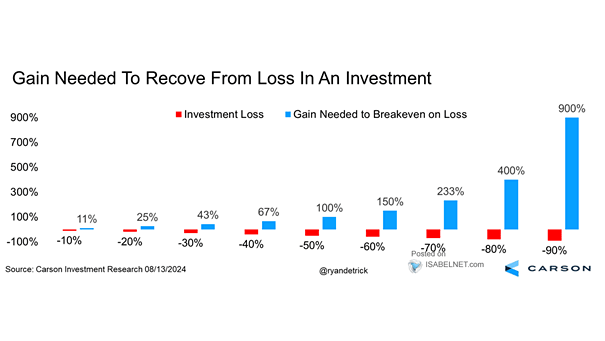
Market – Gain Needed to Recover from Loss in an Investment The greater the potential loss, the more difficult it becomes to recover, potentially leading to significant long-term impacts on an investment portfolio. Image: Carson Investment Research
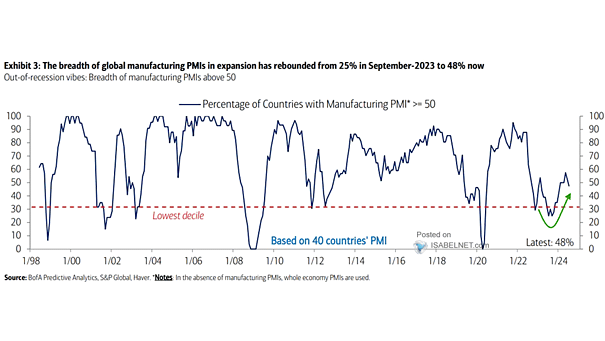
Percentage of Countries with Manufacturing PMI Above 50 While the global manufacturing sector faced headwinds in mid-2023, the latest data suggest a gradual recovery is underway, with the percentage of countries in expansion nearly doubling from September 2023 to the present. Image: BofA Predictive Analytics
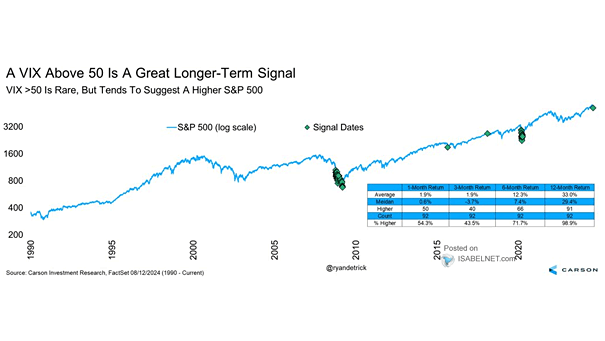
S&P 500 and VIX Above 50 When the VIX exceeded 50, the S&P 500 was higher a year later in 91 out of 92 instances since 1990, with an average gain of 33%. Image: Carson Investment Research