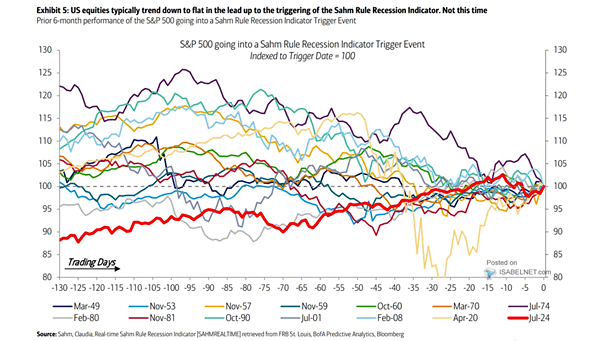
S&P 500 Going into a Sahm Rule Recession Indicator Trigger Event
S&P 500 Going into a Sahm Rule Recession Indicator Trigger Event The recent triggering of the Sahm Rule indicator has diverged from the typical behavior of U.S. equities seen in the lead-up to a recession. Investors should be cautious before drawing conclusions about a potential U.S. recession. Image: BofA Predictive Analytics