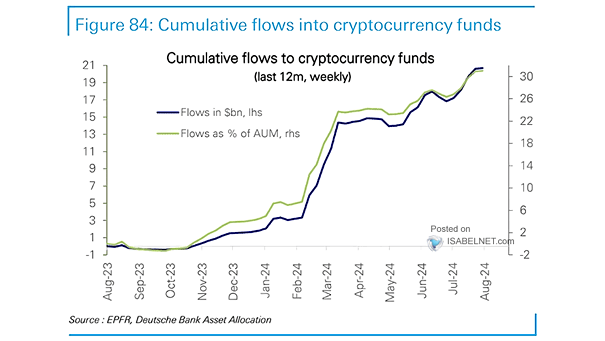
When Do You Expect the U.S. Equity Market Will Peak?

When Do You Expect the U.S. Equity Market Will Peak? 77% of financial advisors believe the bull market will continue beyond 2024, as they expect stellar corporate results, easy financial conditions, and lower interest rates to support its continuation. Image: BofA US Equity & Quant Strategy

S&P 500 and Deviation Above 50-Day Moving Average

S&P 500 and Deviation Above 50-Day Moving Average As the deviation of the S&P 500 index from its 50-day moving average is reaching extreme levels, speculation mounts regarding the potential for a short-term market correction. Image: Real Investment Advice

S&P 500 to M2 Ratio

S&P 500 to M2 Ratio The rising S&P 500 to M2 ratio suggests a potential overvaluation in the U.S. stock market. This trend implies greater demand for stocks compared to the supply of money, worrying investors and analysts. Image: Topdown Charts

U.S. 10-Year Real Rate

U.S. 10-Year Real Rate A potential rise in U.S. real rates could cause the collapse of the AI bubble, leading to turbulence in the stock market. Overvalued AI companies facing declines could trigger widespread market instability, eroding investor confidence. Image: BofA Global Investment Strategy

Euro to U.S. Dollar (EUR/USD)

Euro to U.S. Dollar (EUR/USD) The euro’s decrease in value relative to the U.S. dollar seems to be a result of underlying structural factors. Image: Gavekal, Macrobond

S&P 500 Index – Estimated Next 12-Month Operating Margin

S&P 500 Index – Estimated Next 12-Month Operating Margin The decline in S&P 500 operating margins excluding the Magnificent Seven persists, suggesting that margin headwinds could remain challenging. Image: Morgan Stanley Wealth Management

S&P 500 Deviation From Long-Term 225-Day Moving Average

S&P 500 Deviation From Long-Term 225-Day Moving Average The deviation of the S&P 500 index from its 225-day moving average is reaching rare extremes, prompting speculation about the possibility of an approaching market top. Image: Real Investment Advice

Nasdaq 100 Net Long Futures Contracts

Nasdaq 100 Net Long Futures Contracts Leveraged funds and asset managers have different positions on Nasdaq 100 futures. Leveraged funds are currently very net short on Nasdaq 100 futures, while asset managers have a less bullish but still net long position. Image: Deutsche Bank Asset Allocation

Valuation – S&P 500 Trailing 4Q P/E

Valuation – S&P 500 Trailing 4Q P/E Bullish investors stay long until the trailing PE ratio of the S&P 500 exceeds 25x, signaling potential overvaluation and higher risk, prompting reassessment and defensive strategy shift. Image: BofA Global Investment Strategy

Performance – Semiconductors vs. S&P 500

Performance – Semiconductors vs. S&P 500 The relative outperformance of semiconductor stocks compared to the S&P 500 has surged to its highest level since March 2000, indicating a bullish momentum that bodes well for the broader market. Image: BofA Global Investment Strategy