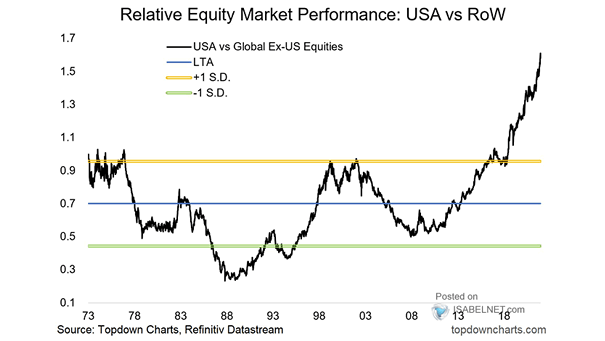
Relative Equity Market Performance – USA vs. Rest of the World
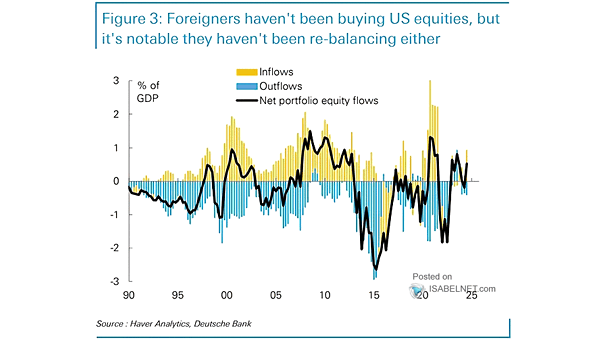
Relative Equity Market Performance – USA vs. Rest of the World U.S. equities have lagged global peers recently, posting their steepest relative underperformance in 15 years. The leadership baton has passed to cheaper, more cyclical markets overseas, pointing to brighter days for the global cycle. Image: Deutsche Bank Research