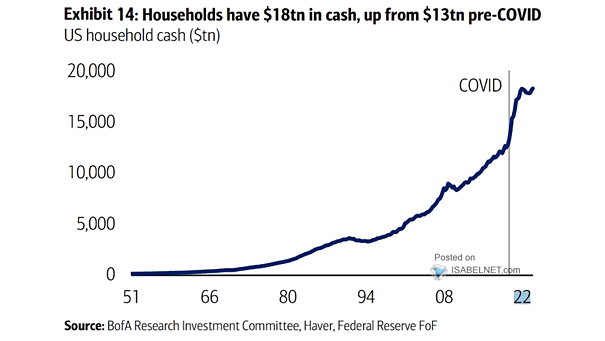
S&P 500 Price 20-Week Change

S&P 500 Price 20-Week Change Since the 1930s, there have been 10 instances of U.S. stocks gaining over 25% in just five months, demonstrating the market’s potential for rapid and significant growth in a relatively short space of time. Image: BofA Global Investment Strategy

S&P 500 EPS Growth vs. Buyback Growth

S&P 500 EPS Growth vs. Buyback Growth While EPS growth may be one factor influencing a company’s decision to repurchase its own shares, it is just one of many potential drivers of buyback activity. Image: Goldman Sachs Global Investment Research

Real Market Cap to GDP Ratio vs. Expected 10-Year Forward Returns

Real Market Cap to GDP Ratio vs. Expected 10-Year Forward Returns The current elevated inflation-adjusted market capitalization to GDP ratio suggests the likelihood of anemic returns for the U.S. stock market over the next 10 years. Image: Real Investment Advice

Tech Flows (Annual Inflows to Tech)

Tech Flows (Annual Inflows to Tech) The significant inflows into tech funds highlight investors’ continued interest in the sector’s growth and innovation potential. Image: BofA Global Investment Strategy

S&P 500 Performance After >20% Gain in 18 Weeks

S&P 500 Performance After >20% Gain in 18 Weeks The S&P 500 index has historically shown strong performance after >20% gains in 18 weeks. On average, one year later, the index has increased in value by 18.1% since 1950. Image: Carson Investment Research

Sentiment/VIX Composite vs. Fed Funds

Sentiment/VIX Composite vs. Fed Funds During a rate hiking campaign, bullish sentiment tends to increase initially, but ultimately ends badly. Image: Real Investment Advice

S&P 500 Equity Risk Premium

S&P 500 Equity Risk Premium Considering the substantial decline in the equity risk premium, which currently stands well below its historical average, should investors approach U.S. equities with caution? Image: BofA US Equity & Quant Strategy

S&P 500 EPS vs. Trend

S&P 500 EPS vs. Trend Do consensus EPS estimates for 2024 and 2025 accurately reflect an optimistic outlook, or are they overly optimistic? Image: J.P. Morgan

Total Equity Fund Flows vs. S&P 500 EPS Growth

Total Equity Fund Flows vs. S&P 500 EPS Growth Over the past 5 weeks, equity funds have seen inflows of $75 billion. The relationship between equity fund inflows and the growth in earnings of S&P 500 companies exhibits a discernible correlation. Image: Deutsche Bank Asset Allocation