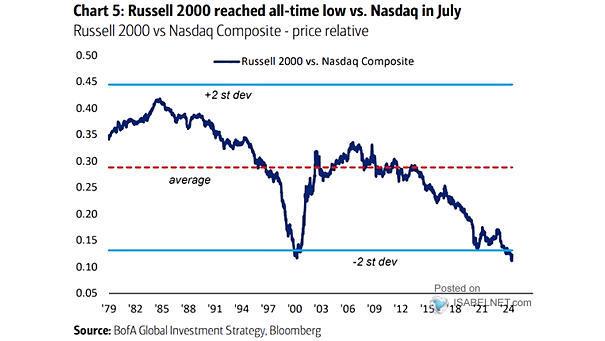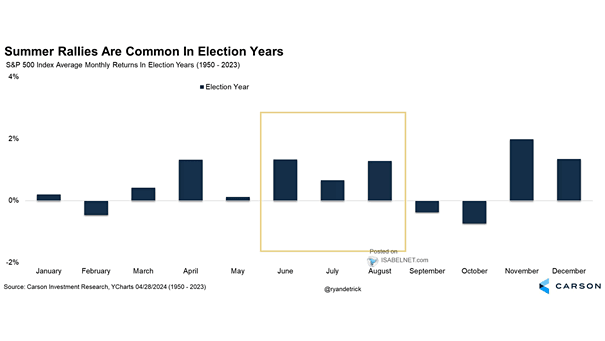
S&P 500 Monthly Returns During an U.S. Election Year
S&P 500 Monthly Returns During an U.S. Election Year The S&P 500 has historically performed well in August during presidential election years, contributing to an overall positive market sentiment and potentially extending the summer rally. Image: Carson Investment Research