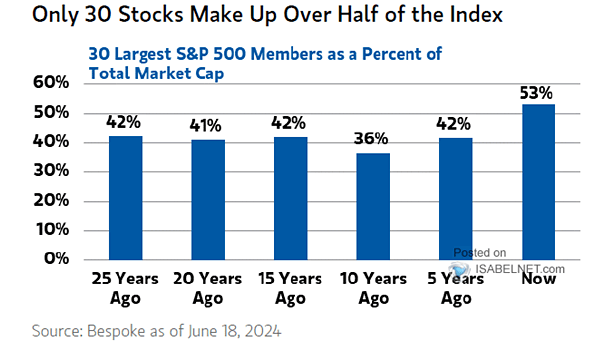
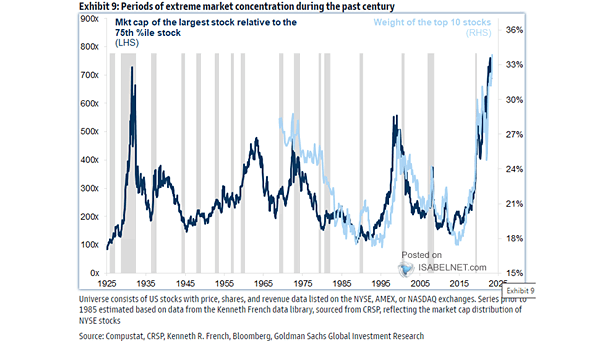
Equity – MSCI Japan Market Cap Relative to World Market Cap

Equity – MSCI Japan Market Cap Relative to World Market Cap Considering the improved outlook, attractive valuations, and progress in corporate governance, should investors consider increasing their exposure to Japanese equities? Image: BofA Global Investment Strategy

What Will Be the Most Important Driver of Equity Prices?

What Will Be the Most Important Driver of Equity Prices? According to FMS investors, the Fed’s decisions will be the main catalyst for the direction and performance of equities in 2024. Image: BofA Global Fund Manager Survey

China GDP Growth

China GDP Growth Excluding the exceptional year of 2020 due to the impact of the Covid pandemic, China’s nominal GDP growth has reached its lowest point since 1976, signaling a shift in China’s economic landscape. Image: Deutsche Bank Research

G3 Real Core Retail Sales

G3 Real Core Retail Sales Since 2019, real core retail sales in the United States have risen significantly, while Germany has seen stagnant growth and Japan has witnessed a decline, reflecting differing economic conditions and consumer behaviors. Image: BofA Global Research

S&P 500 and the Percentage of S&P 500 Stocks Above 50-Day Moving Averages

S&P 500 and the Percentage of S&P 500 Stocks Above 50-Day Moving Averages The percentage of S&P 500 stocks trading above their 50-day moving averages is a warning sign, which could potentially have negative implications for the overall market performance. Image: BofA Global Research

S&P 500 Gross Buybacks to Earnings Ratio

S&P 500 Gross Buybacks to Earnings Ratio It is possible that share buybacks will increase substantially in 2024, if the ratio of S&P 500 gross buybacks to earnings rises to the historical average. Image: Deutsche Bank Asset Allocation

U.S. Recession and Fed Hiking Cycle

U.S. Recession and Fed Hiking Cycle Based on the lags between rate hikes and previous cycles, the likelihood of a recession in the United States remains a topic of discussion. Image: Deutsche Bank

U.S. Dollar Strength vs. Frequency of Reported Revenue Beats

U.S. Dollar Strength vs. Frequency of Reported Revenue Beats A weaker U.S. dollar is correlated with more revenue beats, reflecting the potential benefits of currency depreciation on corporate financial outcomes. Image: Goldman Sachs Global Investment Research

10-Year U.S. Treasury Yield

10-Year U.S. Treasury Yield Since the Global Financial Crisis, there have been only two other occasions where the 10-year U.S. Treasury yield has experienced such a rapid decline, underscoring the exceptional nature of the current situation. Image: Deutsche Bank