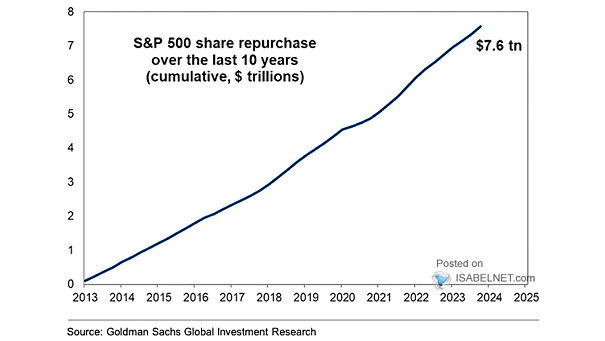
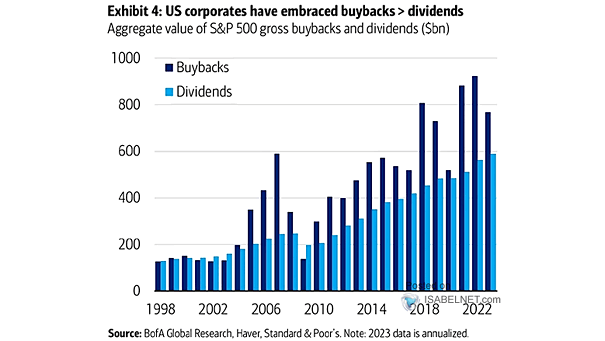
U.S. Unemployment Rate Forecast

U.S. Unemployment Rate Forecast According to Deutsche Bank, a mild recession in the United States may result in a modestly higher unemployment rate than what is anticipated by both consensus and the Federal Reserve. Image: Deutsche Bank

S&P 500 – Average / Median Return by Month

S&P 500 – Average / Median Return by Month January typically emerges as one of the most favorable months for S&P 500 returns. However, February and March often experience a notable decline in returns, presenting a comparatively weaker period for investors. Image: Real Investment Advice

January’s Historical Returns

January’s Historical Returns Throughout history, the performance of the U.S. stock market in the month of January has often served as a reliable indicator for the overall trajectory of the market for the rest of the year. Image: Real Investment Advice

20% Yearly Gains for the S&P 500 Index and What Happened Next

20% Yearly Gains for the S&P 500 Index and What Happened Next A significant annual gain of 20% in the S&P 500 index is often indicative of continued positive performance in the following year, with a median return of 12.1% seen a year later since 1950. Image: Carson Investment Research

S&P 500 Operating Margin

S&P 500 Operating Margin After the COVID-19 pandemic, the operating margins of companies in the S&P 500 have returned to a state of normalcy, leading to a positive trend of improved profitability and cash flows for these companies. Image: Morgan Stanley Wealth Management

S&P 500 Annual Chart

S&P 500 Annual Chart Despite an impressive 24.2% gain in 2023, the S&P 500 index has done virtually nothing over the past two years. When adjusted for inflation, it is still significantly below its peak. Image: Topdown Charts

U.S. GDP Forecast

Range of U.S. GDP YoY Growth Forecasts and Maximum Error over 12-Month Prior While the U.S. economy may avoid a recession in 2024, U.S. GDP forecast dispersion remains at high levels, highlighting the inherent uncertainty and volatility in the current economic landscape. Image: BofA Global Research

Cumulative Cross Asset Flows in % of AUM Terms

Cumulative Asset Flows in % of AUM Terms In 2023, there has been a notable trend of strong inflows into “risk-free” assets, indicating a growing preference for low-risk investment options in an environment of higher yields. Image: Deutsche Bank Asset Allocation

S&P 500 Average Return per Day

S&P 500 Average Return per Day In 2023, U.S. stocks have experienced high performance on Mondays and Fridays. The strong performance of the S&P 500 on Fridays reflects investor optimism and confidence in holding over the weekend. Image: Carson Investment Research

S&P 500 – Margin Debt vs. Long-Term Trend

S&P 500 – Margin Debt vs. Long-Term Trend A rise in the ratio of margin debt to the S&P 500 market cap could indicate a bullish outlook for the U.S. stock market, potentially signaling confidence in the market’s upward trajectory. Image: Topdown Charts