S&P 500 Price Target
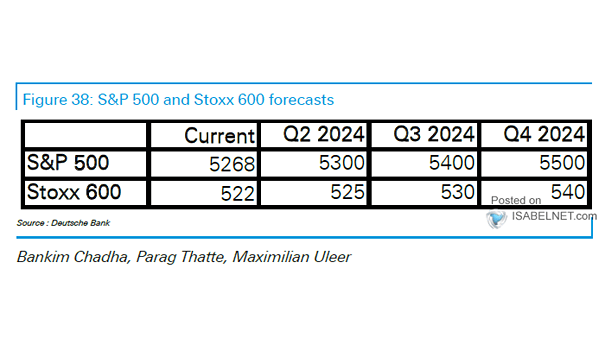
S&P 500 Price Target Citing robust corporate earnings, Deutsche Bank has set a year-end 2024 target of 5,500 for the S&P 500 index. Image: Deutsche Bank
S&P 500 Price Target Citing robust corporate earnings, Deutsche Bank has set a year-end 2024 target of 5,500 for the S&P 500 index. Image: Deutsche Bank
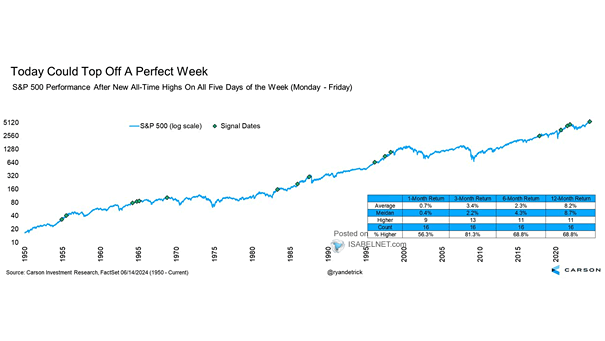
S&P 500 Performance After New All-Time Highs On All Five Days of the Week When the S&P 500 hits new all-time highs on all five days of the week, historical data suggests a bullish outlook over the next 12 months, with a median return of 8.7% since 1950. Image: Carson Investment Research
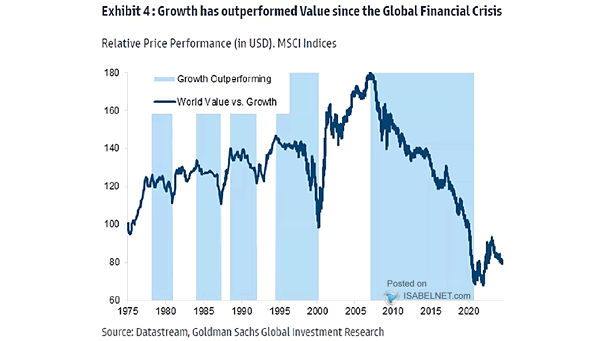
MSCI World Value vs. Growth Given the current market dynamics, will the outperformance of growth stocks over value stocks be reversed in the future, with value stocks potentially taking the lead? Image: Goldman Sachs Global Investment Research
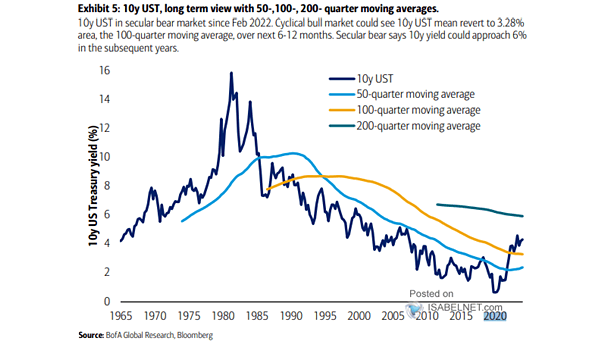
U.S. 10-Year Treasury Yield The 10-year U.S. Treasury yield has been in a secular bear market since February 2022, and it could potentially approach 6% in the coming years. Image: BofA Global Research
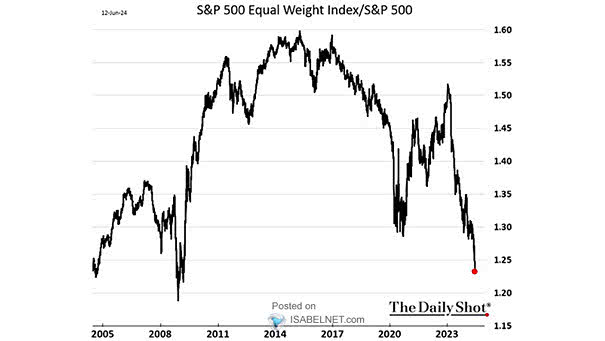
Performance – S&P 500 Equal Weighted / S&P 500 Market Cap Weighted The poor performance of the S&P 500 Equal Weight Index relative to the S&P 500 can be seen as an indication of the lack of broad participation in the market. Image: The Daily Shot
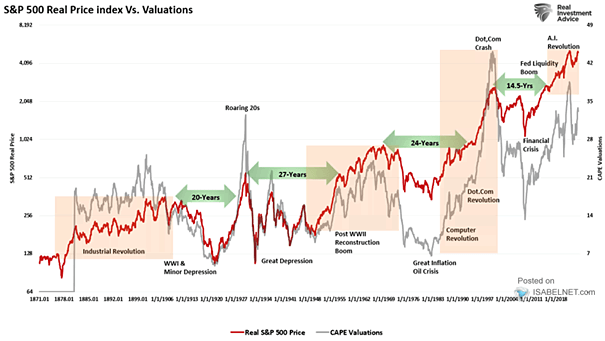
Real S&P 500 vs. Valuations (CAPE) The timing of your investment journey can significantly impact your future outcomes. Even with the Fed’s interventions, recovering from a bear market can take an extended period after speculative “booms.” Image: Real Investment Advice
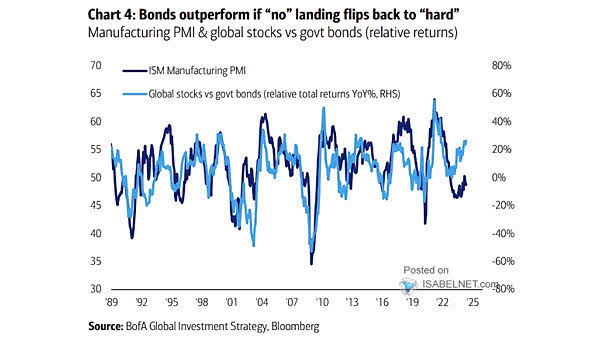
ISM Manufacturing PMI and Global Stocks vs. Government Bonds In a potential shift from a “no” to a “hard” landing scenario, government bonds may outperform due to increased risk aversion, interest rate cuts, lower inflation expectations, and their historical performance during economic downturns. Image: BofA Global Investment Strategy
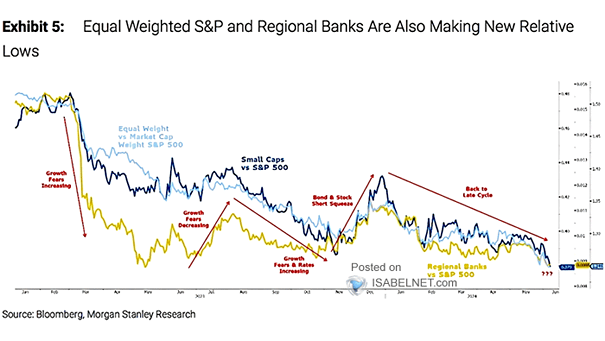
Performance – S&P Regional Banks Index vs. S&P 500 Regional banks and the equal-weighted S&P 500 have recently reached new relative lows, a concerning trend in the financial market. This trend is noteworthy given the recent S&P 500 performance. Image: Morgan Stanley Research
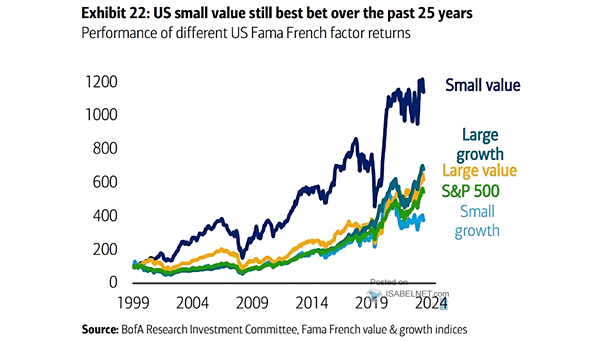
Performance of Different U.S. Fama French Factor Returns U.S. small-cap value has been the best bet over the past 25 years. However, small-cap value stocks are typically more volatile in the short term, making a long-term investment strategy necessary. Image: BofA Research Investment Committee
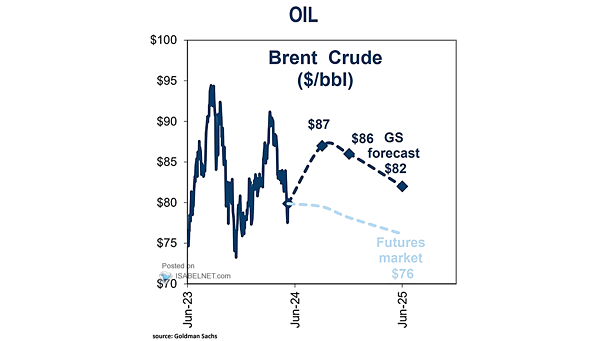
Price of Oil Forecast In contrast to futures market’s expectations, Goldman Sachs forecasts a positive outlook for oil prices over the next 3 months. Image: Goldman Sachs Global Investment Research
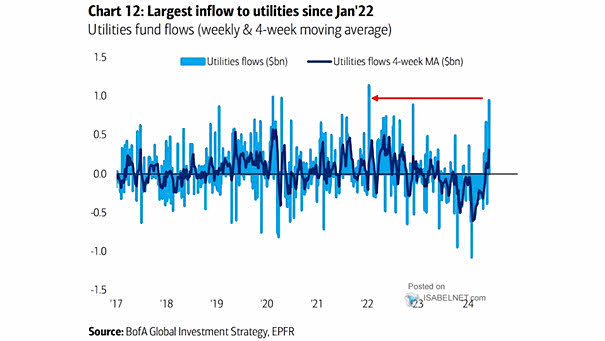
Utilities Flows Utility funds continue to attract strong inflows, making them a popular choice for investors seeking stable and predictable returns. Image: BofA Global Investment Strategy