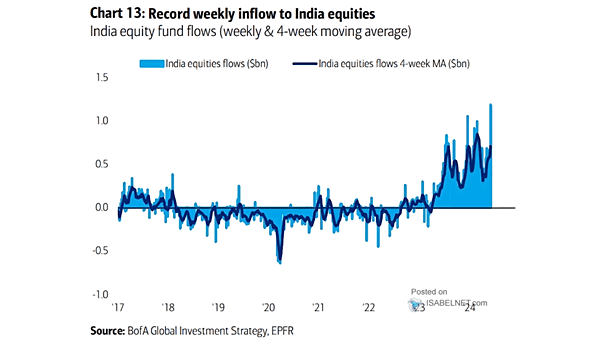
India Equity Fund Flows
India Equity Fund Flows Investor behavior and sentiment are frequently gauged by analyzing fund flows. Over the past week, India equity funds experienced record inflows, indicating a surge in optimism among investors. Image: BofA Global Investment Strategy