Nasdaq 100 vs. Commodities
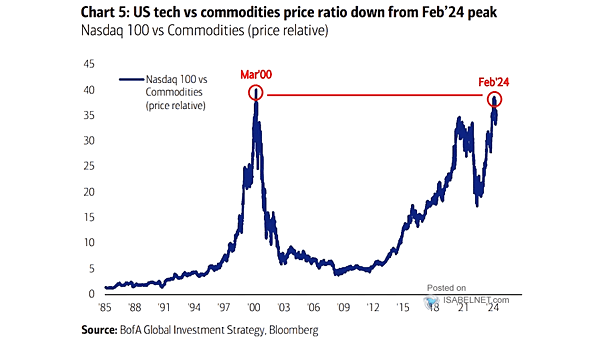
Nasdaq 100 vs. Commodities Will commodities outperform U.S. tech going forward? Image: BofA Global Investment Strategy
Nasdaq 100 vs. Commodities Will commodities outperform U.S. tech going forward? Image: BofA Global Investment Strategy
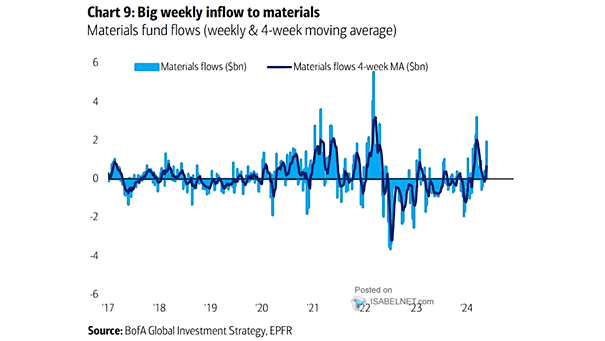
Materials Flows Fund flows are widely regarded as an indicator of investor behavior and sentiment. Strong weekly inflows in materials suggest optimistic investor interest and confidence. Image: BofA Global Investment Strategy
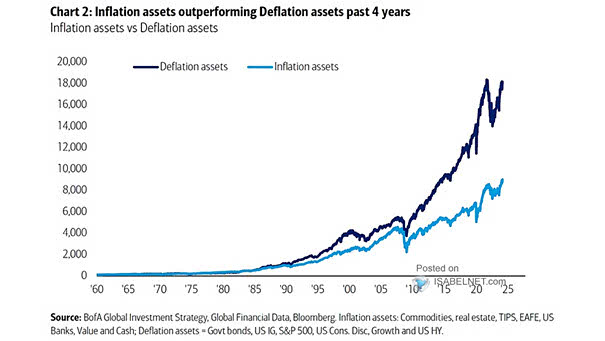
Inflation Assets and Deflation Assets In order to mitigate inflation risks, should investors increase their allocation to inflation assets and decrease their exposure to deflation assets in their portfolio? Image: BofA Global Investment Strategy
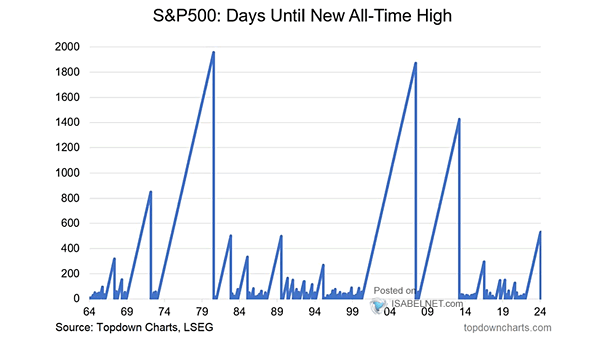
S&P 500 Number of Consecutive Days Without Reaching New All-Time High While reaching all-time highs can present opportunities, investors sometimes have to wait a very long time before the S&P 500 reaches a new all-time high. Image: Topdown Charts
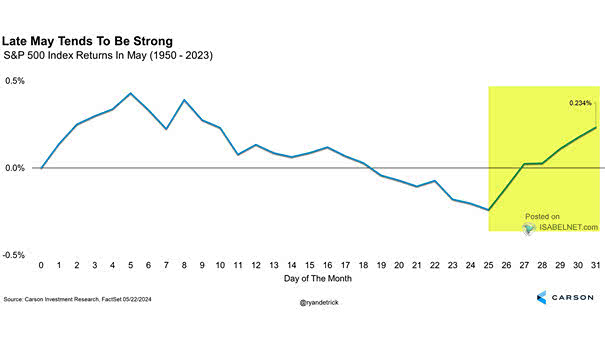
Seasonality – S&P 500 Index Returns in May The middle of May is historically a period of weakness for U.S. stocks, while the end of May typically exhibits strength. Image: Carson Investment Research
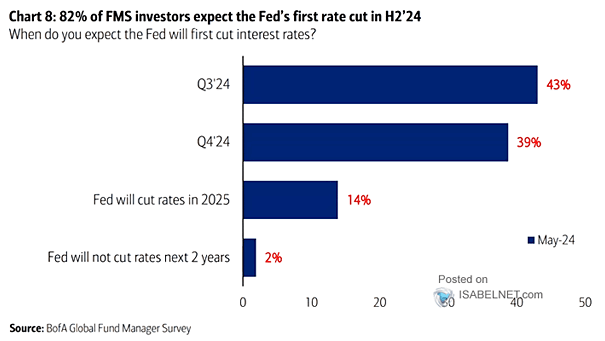
When Will the Fed First Cut Interest Rates? Will the Fed lower interest rates in the second quarter of 2024? This decision holds significant implications for financial markets and the economy. Image: BofA Global Fund Manager Survey
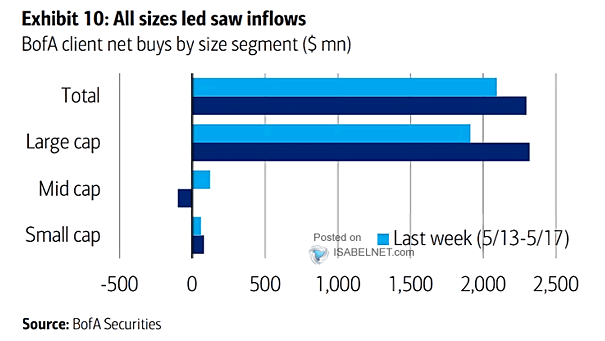
Net Buys by Size Segment Bofa’s clients maintain their preference for large-caps, while showing less interest in small-caps and mid-caps. Image: BofA Securities
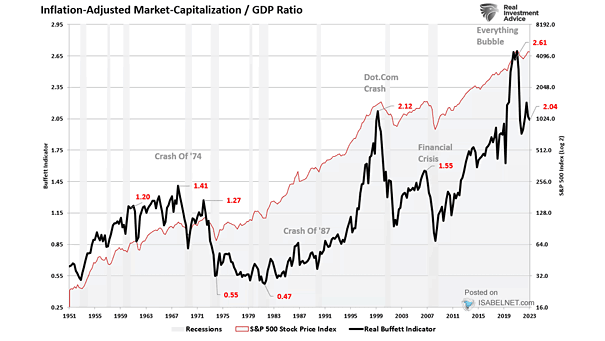
S&P 500 Valuation – Real Market Capitalization to Real GDP Ratio The inflation-adjusted market capitalization to GDP ratio is a valuable tool to evaluate the U.S. stock market’s valuation. The high current ratio implies a potential overvaluation. Image: Real Investment Advice
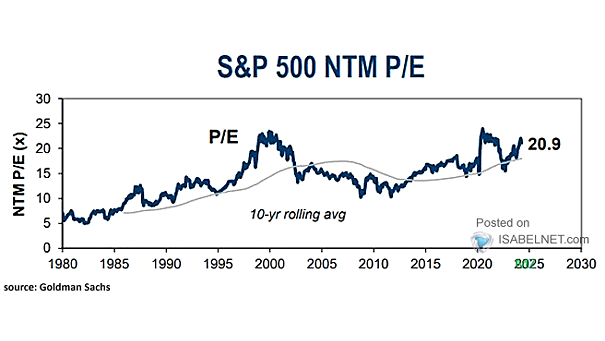
Valuation – S&P 500 Next-Twelve-Month P/E Ratio The S&P 500 NTM P/E ratio is currently at a high level of 20.9, indicating that investors are willing to pay a relatively high price for each dollar of expected earnings in the next twelve months. Image: Goldman Sachs Global Investment Research
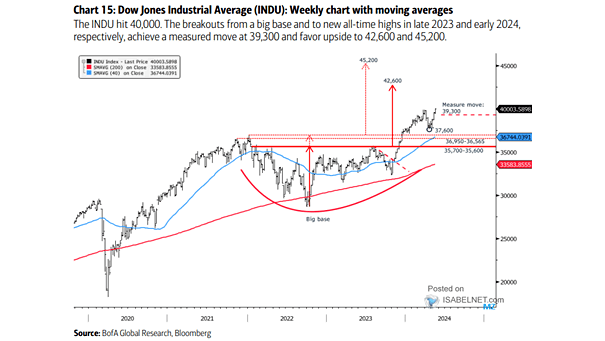
Dow Jones Industrial Average Weekly Chart with Moving Averages The technical analysis suggests that the Dow Jones may potentially surpass the 42,600 mark in the near term, with the possibility of further gains towards the 45,200 level. Image: BofA Global Research
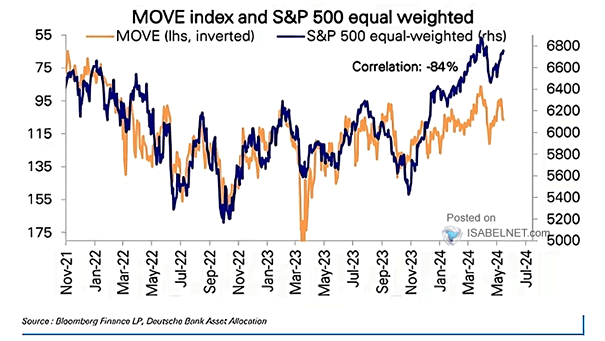
MOVE Index vs. S&P 500 Equal Weighted Assuming bond volatility continues to decline, will the S&P 500 equal weighted index continue to rise? Image: Deutsche Bank Asset Allocation