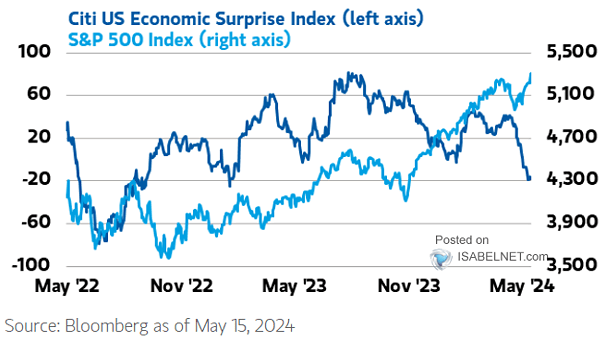
S&P 500 Index vs. U.S. Citi Economic Surprise Index
S&P 500 Index vs. U.S. Citi Economic Surprise Index The S&P 500 Index and the U.S. Citi Economic Surprise Index are often closely correlated. But right now, bad news is good news, until it’s not. Image: Morgan Stanley Wealth Management