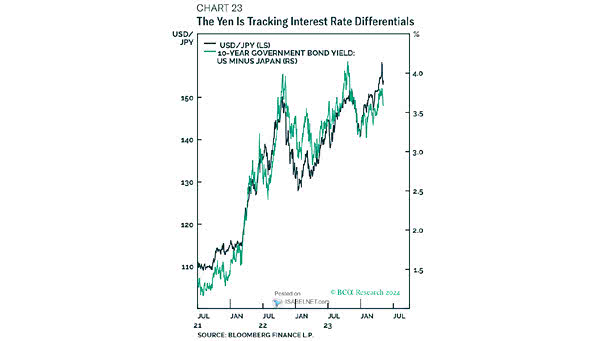
Flow – % Share of Rolling One-Month ETF Inflows

Flow – % Share of Rolling One-Month ETF Inflows Investors continue to put their money into large and mid-cap equity funds, as evidenced by their behavior reflected in ETF flows over the past month. Image: Arbor Research & Trading LLC Click the Image to Enlarge

S&P 500 Price Forecasts vs. Market Pricing

S&P 500 Price Forecasts vs. Market Pricing Goldman Sachs, in its base case scenario, forecasts that the S&P 500 will reach a level of 4,700 by the end of 2024. Image: Goldman Sachs Global Investment Research

S&P 500 Stocks and Non-S&P 500 Stocks as a % of U.S. Large Cap Funds AUM

S&P 500 Stocks and Non-S&P 500 Stocks as a % of U.S. Large Cap Funds AUM Despite the abundance of stocks, the lack of interest in investing beyond the “Magnificent Seven” creates bias, leading to excessive attention and favoritism that may undervalue or neglect other investment opportunities. Image: BofA US Equity & Quant Strategy

Financial Conditions and U.S. Recessions

Financial Conditions and U.S. Recessions The Fed may face challenges due to looser financial conditions, as it requires tighter conditions in order to effectively curb inflation towards its 2% target. Will the Fed adopt a more hawkish stance next month? Image: Real Investment Advice

S&P 500 – Monthly Seasonality for Year 3 of the Presidential Cycle

S&P 500 – Monthly Seasonality for Year 3 of the Presidential Cycle Investors and traders can gain valuable insights from historical trends. In the third year of the presidential cycle, December has historically been a strong month for U.S. stocks. Image: BofA Global Research

S&P 500 Performance After Four Week Win Streak >10%

S&P 500 Performance After Four Week Win Streak >10% When the S&P 500 experiences four consecutive weeks of gains and achieves a cumulative increase of over 10% throughout this period, it can be interpreted as an indication of robustness and resilience in the market. Image: Carson Investment Research

Valuation – Distribution of Sector FY2 P/E Ratios Relative to S&P 500

Valuation – Distribution of Sector FY2 P/E Ratios Relative to S&P 500 The energy sector’s discount to the S&P 500 suggests potential investment opportunities for those who believe in the energy sector’s long-term growth prospects. Image: Goldman Sachs Global Investment Research

Passive vs. Active Rolling 6-Month Flows

Passive vs. Active Rolling 6-Month Flows Flows into passive mutual funds and ETFs continue to surpass those into active funds. This trend is driven by factors such as lower costs, strong performance, and the rise of ETFs. Image: Goldman Sachs Global Investment Research