U.S. Treasury Price vs. 200-Day Moving Average
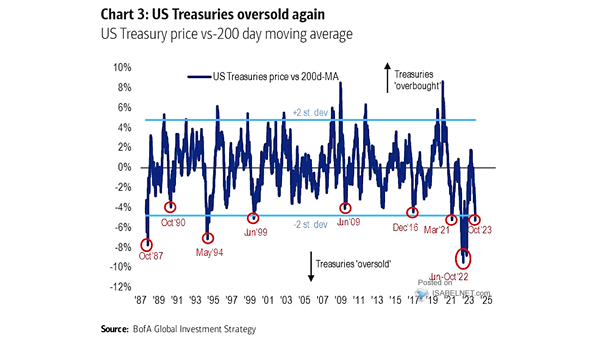
U.S. Treasury Price vs. 200-Day Moving Average Should investors continue shorting U.S. bonds until bond yields exceed 5%? Image: BofA Global Investment Strategy
U.S. Treasury Price vs. 200-Day Moving Average Should investors continue shorting U.S. bonds until bond yields exceed 5%? Image: BofA Global Investment Strategy
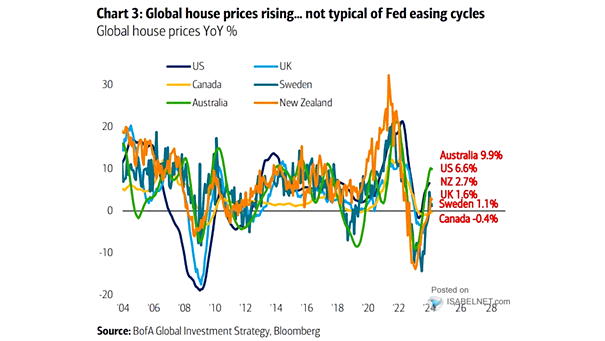
Housing – Global House Prices With a year-over-year increase of 6.6%, U.S. house prices are posing a greater challenge for prospective homebuyers in their pursuit of purchasing a home. Image: BofA Global Investment Strategy
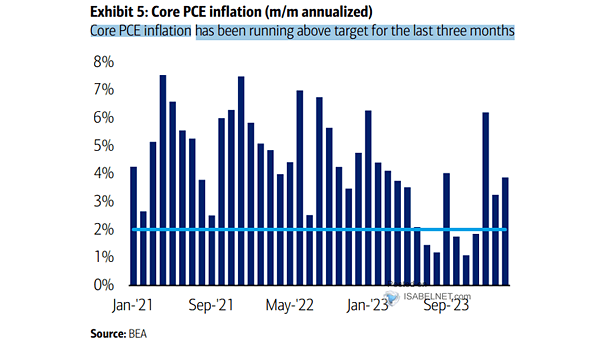
U.S. Core PCE Inflation For the past three months, U.S. core PCE inflation, the Federal Reserve’s favored gauge of inflation, has consistently exceeded the 2% target. Image: BofA Global Research
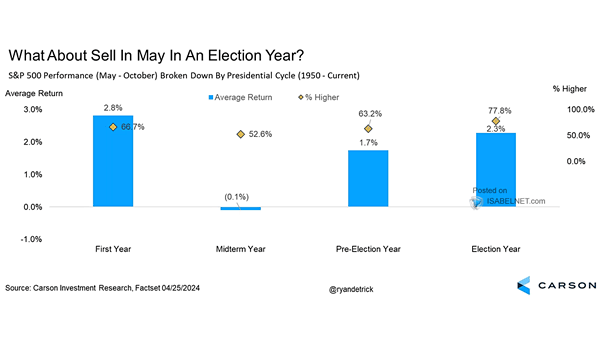
S&P 500 Performance (May – October) Broken Down by Presidential Cycle Sell in May and go away? Since 1950, the S&P 500 has shown an average return of 2.3% during the period from May through October in election years, making it an attractive period for investors. Image: Carson Investment Research
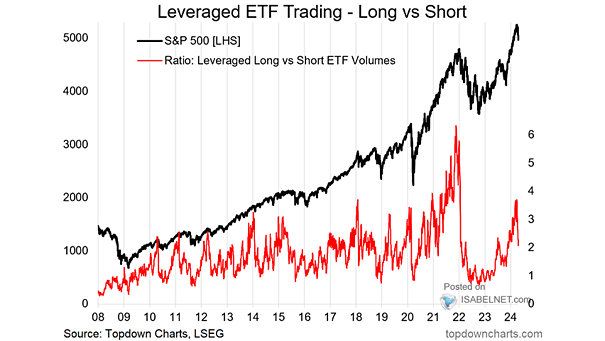
S&P 500 and Leveraged Long vs. Short ETF Volumes The degree of activity in leveraged long vs. short U.S. equity ETFs has experienced a substantial decline as sentiment shifts. Image: Topdown Charts
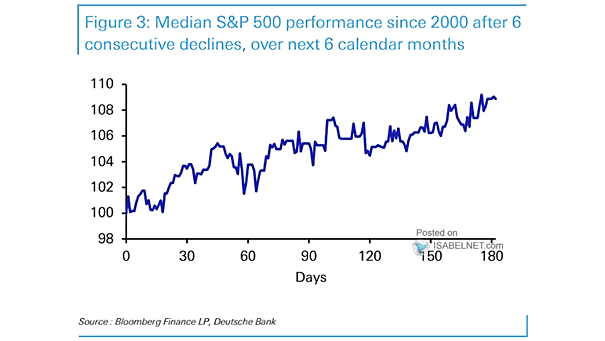
Median S&P 500 Performance Since 2000, the median S&P 500 performance after 6 consecutive declines has been 8.9% over the next 6 months, indicating a potential for a significant rebound and recovery in the stock market. Image: Deutsche Bank
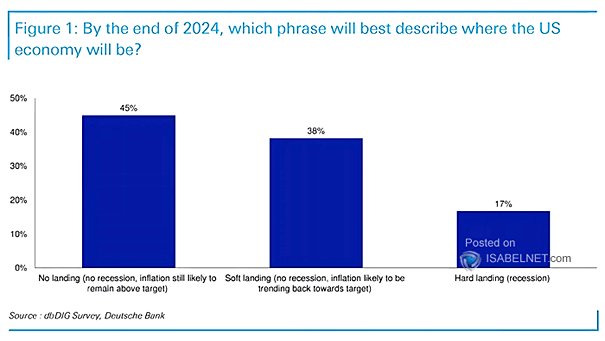
U.S. Economy A recent Deutsche Bank survey found that 45% of participants predict a “no-landing” scenario for the U.S. economy by the end of 2024. This suggests no recession and inflation will remain above the Fed’s 2% target. Image: Deutsche Bank
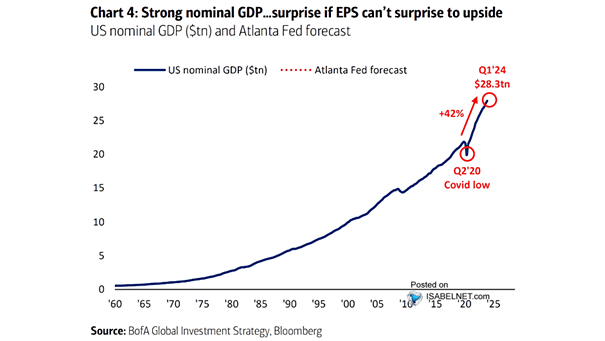
U.S. Nominal GDP The strength of U.S. nominal GDP has been crucially supported by fiscal and monetary policies, along with other contributing factors. Image: BofA Global Investment Strategy
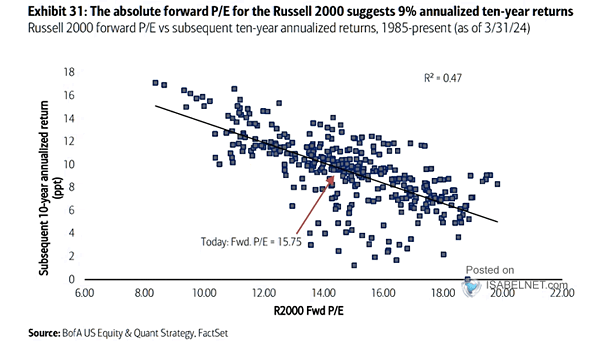
Russell 2000 Forward P/E vs. Subsequent 10-Year Annualized Returns Should long-term investors increase their allocation to U.S. small-cap stocks, given the potential for 9% annualized ten-year returns suggested by the absolute forward P/E for the Russell 2000? Image: BofA US Equity & Quant Strategy
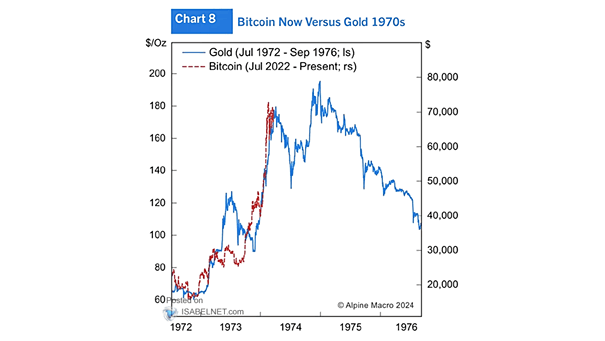
Bitcoin vs. Gold Bitcoin’s current price shares similarities with the price of gold in the 1970s. Image: Alpine Macro
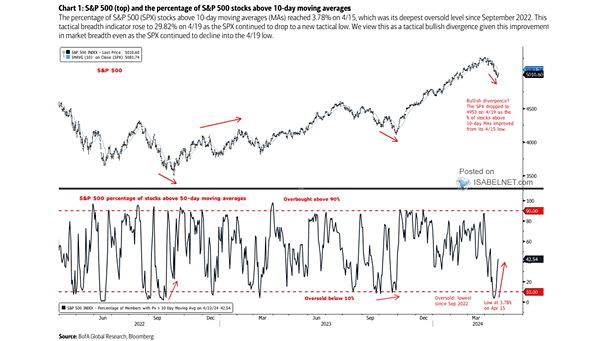
S&P 500 and the Percentage of Stocks Above 10-Day MAs The rise in the percentage of S&P 500 stocks above their 10-day moving averages can be interpreted as a tactical bullish divergence, providing valuable insights into market strength and the potential for a reversal. Image: BofA Global Research