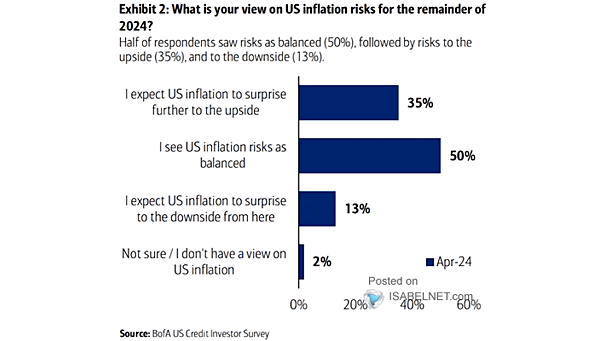
Median Sector Returns in the Year Before U.S. Election Day

Median Sector Returns in the Year Before U.S. Election Day Given the historical trend of the tech sector underperforming the S&P 500 in the year preceding the U.S. election day, should investors consider underweighting their exposure to the tech sector in their portfolios? Image: Goldman Sachs Global Investment Research

S&P 500 Earnings Revisions Breadth

S&P 500 Earnings Revisions Breadth Earnings revisions breadth for both large and small caps has returned to negative territory, which means that the overall sentiment and expectations for future earnings have worsened. Image: Morgan Stanley Research

Gold Price vs. S&P 500

Gold Price vs. S&P 500 Since January 2022, gold has demonstrated a superior performance compared to U.S. stocks, particularly in the face of geopolitical uncertainty and rising inflation worldwide. Image: Morgan Stanley Wealth Management

S&P 500, U.S. 10-Year Yield and U.S. Dollar Index

S&P 500, U.S. 10-Year Yield and U.S. Dollar Index Peaks in the U.S. dollar and U.S. 10-year Treasury yields are seen as essential to catalyze a year-end rally in the S&P 500. Image: BofA Global Research

Cumulative Inflows to U.S. ETFs with Derivative Income Strategies

Cumulative Inflows to U.S. ETFs with Derivative Income Strategies Over the course of the past two years, the scale of capital flows into U.S. ETFs via options strategies has increased dramatically, reflecting a shift in investor preferences and strategies. Image: BofA ETF Research

Cash + T-bills % of AUM

Cash + T-bills % of AUM Will cash and T-bills serve as the driving force behind the bull markets of 2024? Image: BofA Global Investment Strategy

U.S. Housing Market – MBA Purchase Index

U.S. Housing Market – MBA Purchase Index Mortgage applications in the U.S. continue to decline due to a combination of high interest rates and elevated home prices, resulting in a 28-year low. Image: The Daily Shot

S&P 500 Index Valuation vs. Fed Funds Rate

S&P 500 Index Valuation vs. Fed Funds Rate Given that much of the stock market’s progress this year can be attributed to valuation expansion, it is likely that U.S. stocks will eventually experience a correction to adjust to the impact of higher interest rates. Image: Real Investment Advice

S&P 500 6-Month Seasonality

S&P 500 6-Month Seasonality November through April is considered the optimal 6-month period for the S&P 500, as historical analysis suggests stronger performance compared to the other six months of the year. Image: BofA Global Research

S&P 500 Performance When Down In October, But Still Positive YTD

S&P 500 Performance When Down In October, But Still Positive YTD When the S&P 500 declines in October but maintains a positive performance since the beginning of the year, historical trends suggest that the last two months of the year tend to show positive returns. Image: Carson Investment Research