Global Oil Demand Growth
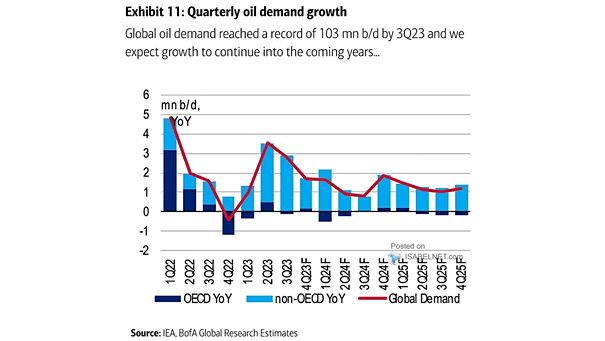
Global Oil Demand Growth BofA forecasts that global oil demand will continue to grow, but at a slower pace in the coming years, due to the increasing efficiency of energy technology. Image: BofA Global Research Estimates
Global Oil Demand Growth BofA forecasts that global oil demand will continue to grow, but at a slower pace in the coming years, due to the increasing efficiency of energy technology. Image: BofA Global Research Estimates
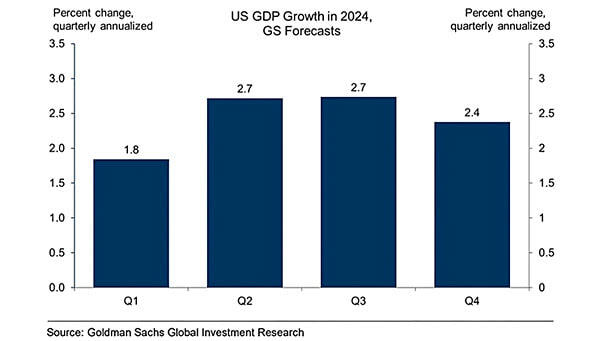
U.S. GDP Growth Forecast Goldman Sachs expresses confidence in the robustness of the U.S. economy, foreseeing a positive outlook for the growth of U.S. GDP. Image: Goldman Sachs Global Investment Research
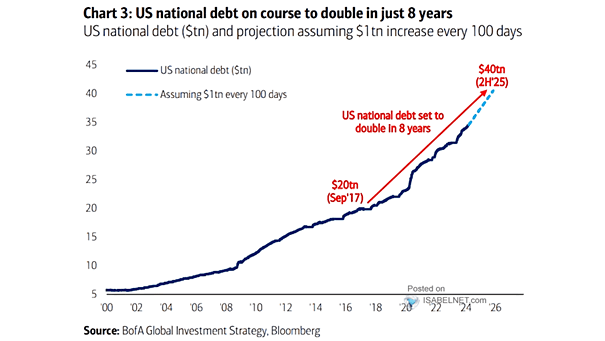
U.S. National Debt The U.S. national debt has surpassed a staggering $34 trillion, and the trajectory of this ever-increasing debt raises concerns about long-term economic sustainability. Image: BofA Global Investment Strategy
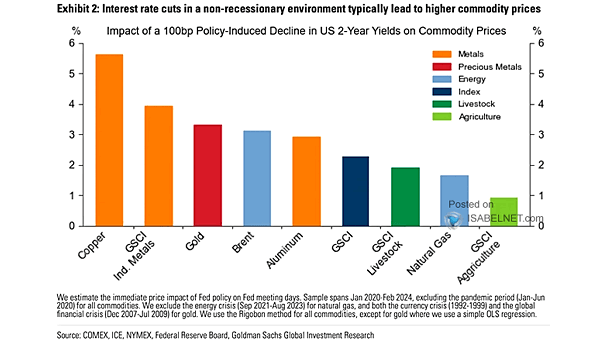
Commodities – Commodity Prices In a non-recessionary environment, lower U.S. interest rates can lead to an increase in commodity prices, particularly metals, gold, and brent crude oil. Image: Goldman Sachs Global Investment Research
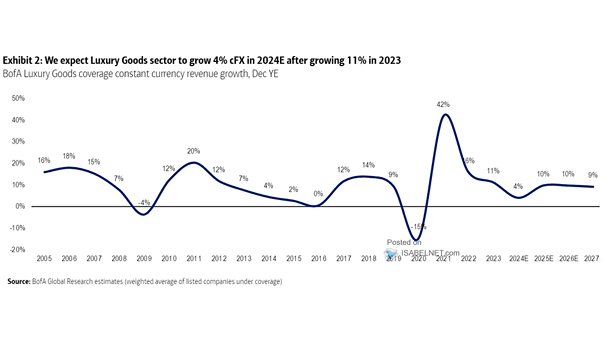
Luxury Goods Coverage Constant Currency Revenue Growth The luxury goods sector is expected to grow by 4% in 2024, suggesting a slight decline in the luxury goods market compared to the previous year. Image: BofA Global Research
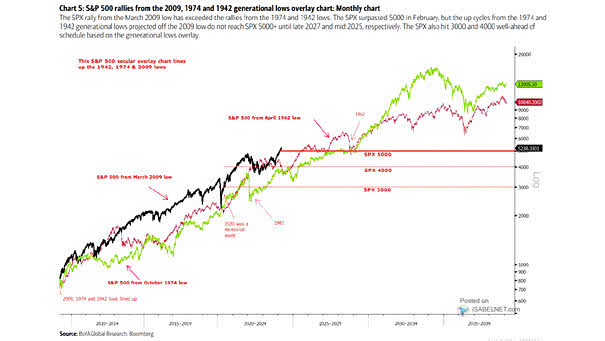
Secular Bull Market Analogs and S&P 500 Since the Great Recession, U.S. stocks have behaved like a secular bull market, which is characterized by an extended period of growth and rising prices. Image: BofA Global Research
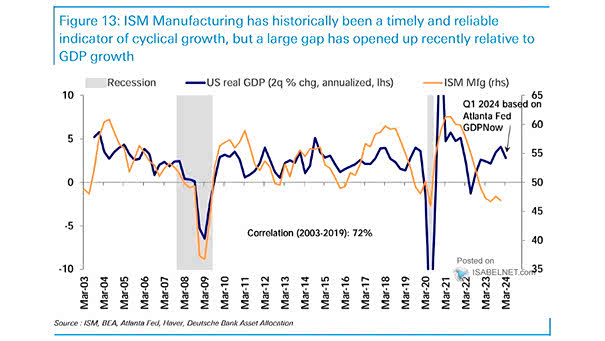
U.S. ISM Manufacturing Index and U.S. GDP Growth The large gap that currently exists between the U.S. ISM Manufacturing Index and U.S. real GDP will eventually close, as economic indicators tend to align over time. Image: Deutsche Bank Asset Allocation
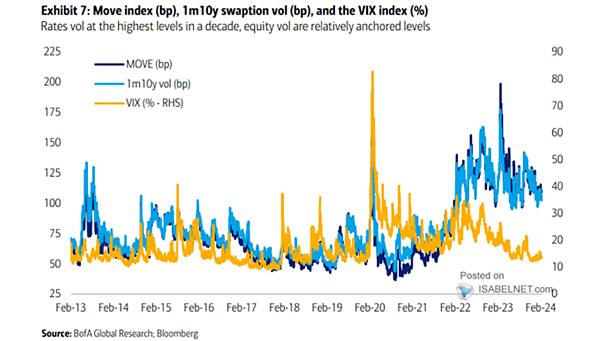
Volatility Divergence – VIX vs. MOVE The divergence between VIX and MOVE presents unique challenges and opportunities for market participants, reflecting different expectations and perceptions of risk in the equity and bond markets. Image: BofA Global Research
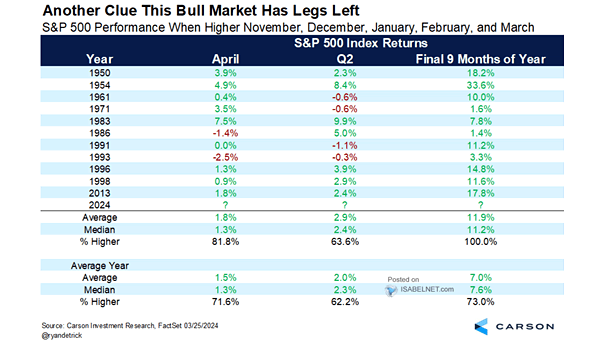
S&P 500 Performance When Higher in November, December, January, February, and March Since 1950, when the S&P 500 index has been higher in November, December, January, February, and March, the rest of the year has been higher 100% of the time, with an average gain of 11.9%. Image: Carson Investment Research
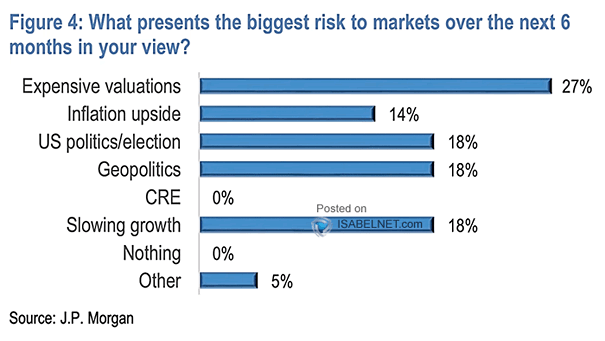
What Presents the Biggest Risk to Markets over the Next 6 Months in Your View? According to a recent survey, 27% of JPM customers consider high valuations to be the biggest risk to markets, indicating a growing concern about the potential for overinflated asset prices. Image: J.P. Morgan
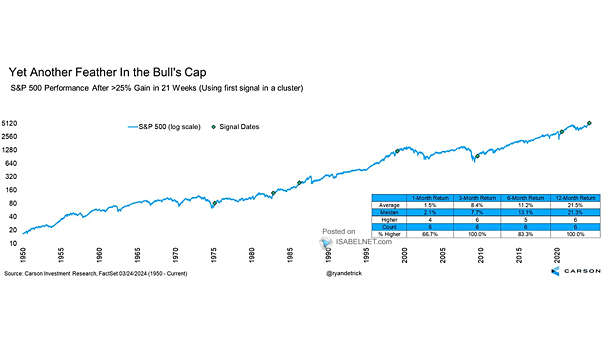
S&P 500 Performance After >25% Gain in 21 Weeks A 25% or more increase in the S&P 500 in 21 weeks (using the first signal in a cluster) suggests a bullish outlook over the next 12 months, with an average gain of 21.5% since 1950. Image: Carson Investment Research