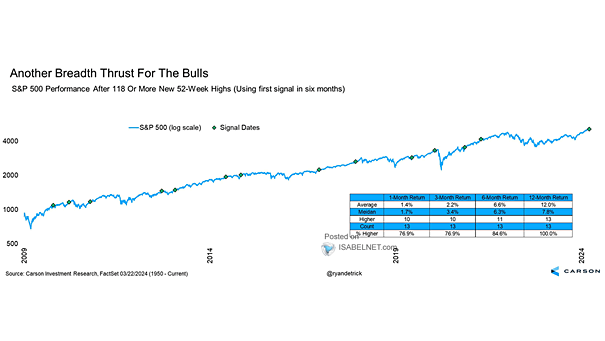
Returns – Value vs. Growth

Returns – Value vs. Growth Value stocks tend to outperform growth stocks when considering a longer time frame. Image: BofA Research Investment Committee

Months That S&P 500 Index Bear (and Near Bear) Markets End

Months That S&P 500 Index Bear (and Near Bear) Markets End U.S. stocks have demonstrated a tendency to reach their lowest point of decline during the month of October, a pattern that has been observed over time. Image: Carson Investment Research

U.S. Average Credit Card Rate

U.S. Average Credit Card Rate Record-high credit card interest charges indicate significant financial burdens for cardholders, which can have important implications for both individual cardholders and the broader U.S. economy. Image: The Daily Shot

Return – Austria 100-Year Bond

Return – Austria 100-Year Bond Despite significant prior returns, the 100-year Austrian government bond’s long-term nature increased its susceptibility to interest rate fluctuations, resulting in the crash. Image: BofA Global Investment Strategy

GDP Consensus Forecasts

GDP Consensus Forecasts Optimistic U.S. GDP forecasts suggest that there is confidence in the underlying strength of the U.S. economy. Image: BofA Global Research

Asset Class Quilt of Total Returns

Asset Class Quilt of Total Returns Despite experiencing a significant selloff, the S&P 500 has managed to maintain its position as the top-performing asset since the start of the year, outperforming other investment options in the market. Image: BofA Global Investment Strategy Click the Image to Enlarge