Performance – Semiconductors vs. S&P 500
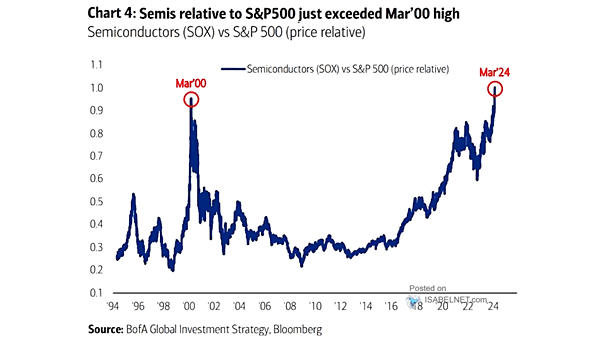
Performance – Semiconductors vs. S&P 500 The relative outperformance of semiconductor stocks compared to the S&P 500 has surged to its highest level since March 2000, indicating a bullish momentum that bodes well for the broader market. Image: BofA Global Investment Strategy