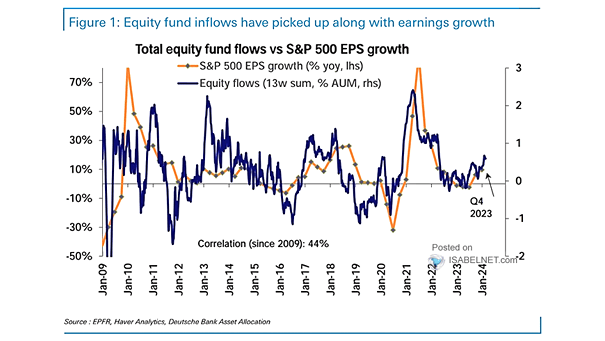
Sentiment – Global PMI and Risk Appetite Indicator

Sentiment – Global PMI and Risk Appetite Indicator The GS risk appetite indicator remaining elevated suggests that investors have a high appetite for risk in the financial markets. Image: Goldman Sachs Global Investment Research

Hard/Soft/No Landing Pricing Across Asset Classes

Hard/Soft/No Landing Pricing Across Asset Classes Investors may allocate cash to bonds in hard landing, a combination of stocks and credit in soft landing, commodities in no landing. Image: BofA Global Investment Strategy

Macro Forecasts

Macro Forecasts Goldman Sachs predicts that the S&P 500 will reach 4,700 and the 10-year U.S. Treasury yield will be at 3.8% in 12 months. Image: Goldman Sachs Global Investment Research

U.S. Real GDP “New-New Normal”

U.S. Real GDP “New-New Normal” Will a sustained period of low economic growth be the “new normal” for the United States? Image: Real Investment Advice

Consecutive Trading Days of Inverted 10Y-3M U.S. Treasury Yield Curve

Consecutive Trading Days of Inverted 10Y-3M U.S. Treasury Yield Curve The inversion of the 10Y-3M UST yield curve typically reflects market expectations of slower economic growth and potentially lower interest rates in the future. Image: Morgan Stanley Wealth Management

S&P 500 – Duration Between 3%+ Selloffs

S&P 500 – Duration Between 3%+ Selloffs 3%+ selloffs in the U.S. stock market have occured within 47 trading days on average since World War II. Image: Deutsche Bank Asset Allocation

Inflation – U.S. Core CPI

Inflation – U.S. Core CPI Goldman Sachs forecasts that U.S. core CPI will be 3.0% in December 2024. Image: Goldman Sachs Global Investment Research

S&P 500 EPS Estimates

S&P 500 EPS Estimates Goldman Sachs is more optimistic than consensus on EPS estimates for 2023 and 2024. Image: Goldman Sachs Global Investment Research

S&P 500 – Duration Between 5%+ Selloffs

S&P 500 – Duration Between 5%+ Selloffs 5%+ selloffs in the U.S. stock market have occured within 88 trading days on average since World War II. Image: Deutsche Bank Asset Allocation

U.S. Dollar vs. Real Interest Rates

U.S. Dollar vs. Real Interest Rates Higher real interest rate differentials between the United States and the world are generally associated with a stronger U.S. dollar. Image: BCA Research