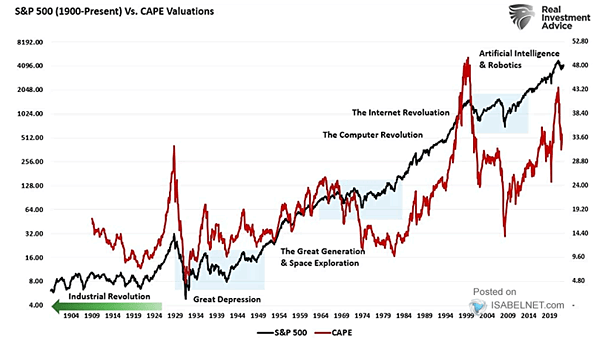
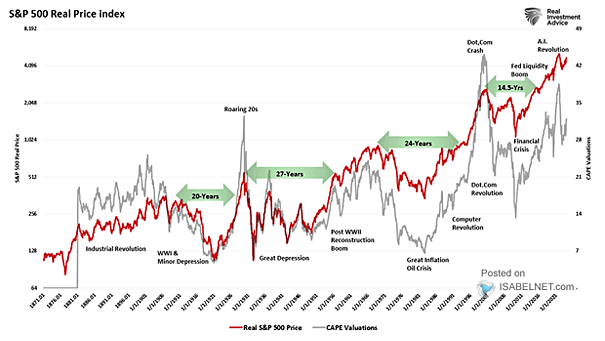
U.S. Crude Oil
U.S. Crude Oil The U.S. days of crude oil supply, including the Strategic Petroleum Reserve (SPR), have decreased to 46 days, which is a 40-year low. Image: BofA Global Investment Strategy
China and Mexico as % of U.S. Imports For the first time since 2003, the United States currently imports more goods from Mexico than from China. Will this trend continue? Image: BofA Global Investment Strategy
Performance – Percentage Point Difference between S&P 500 and Equal-Weighted S&P 500 Annual Price Moves The outperformance of the S&P 500 vs. the S&P 500 equal-weighted is the biggest since 1998. Image: Deutsche Bank
S&P 500 Average Negative Sentiment Score YoY vs. Quarterly EPS YoY (Leading Indicator) The significant increase in corporate sentiment indicates a potential recovery in earnings, which is good news. Image: BofA Global Research
Cumulative U.S. Equity Flows Large-cap and blended funds are the main source of U.S. equity flows year-to-date. Image: Deutsche Bank Asset Allocation
U.S. Dollar Index and Purchasing Power Parity Fair Value According to the measure of Purchasing Power Parity fair value, the U.S. dollar remains overvalued. Image: BCA Research
Interest Rates – Probability of Fed Rate Hike The likelihood of the Federal Reserve holding interest rates steady in September has increased. Image: The Daily Shot
Cumulative Tech Flows Will investors’ love of tech stocks continue? Image: BofA Global Investment Strategy
Average of Straddle Buying Returns Buying straddles into earnings is a popular speculative tactic for trading stock volatility, which has proven to be a successful strategy thus far in 2023. Image: Goldman Sachs Global Investment Research
S&P 500 Daily % Change Typically, the best days in the U.S. stock market often come after the worst days. Investors usually observe clusters of the S&P 500’s largest percentage gains during challenging periods. Image: Real Investment Advice
Average of Analyst Day Stock Performance The stock performance during analyst days in 2023 has generally been positive, with an average increase of 0.2% year-to-date. Image: Goldman Sachs Global Investment Research