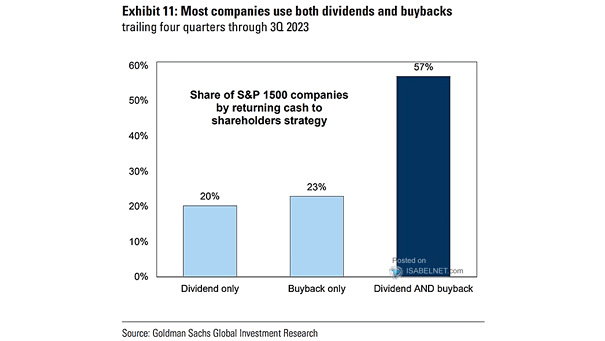
China Real GDP Growth vs. Current Activity Indicator (CAI)
China Real GDP Growth vs. Current Activity Indicator (CAI) Goldman Sachs forecasts China real GDP growth of 5.4% in 2023 and 4.5% in 2024. Image: Goldman Sachs Global Investment Research
U.S. Equity Exposure vs. ISM New Orders less Inventories U.S. equity exposure typically shows a correlation with the ISM New Orders less Inventories. Image: Nomura
U.S. Unemployment Rate vs. 10-Year UST Yield and 3-Month UST Yield A bull steepener occurs when the U.S. unemployment rate increases. Image: Gavekal, Macrobond
Number of Times Dollar Has Gained in the Month Since 2017 The U.S. dollar has typically shown strength in the month of September. Will this year be any different? Image: Bloomberg
Big 4 Asia Imports vs. ISM Manufacturing PMI The weak demand in Asian markets is affecting various industries and economies worldwide. Image: BofA Global Investment Strategy
Gold vs. 10-Year U.S. Real Rate Gold tends to be negatively correlated with U.S. real interest rates. Is gold at risk of price decline? Image: Morgan Stanley Wealth Management
Housing Market – U.S. Home Purchase Mortgage Applications Concerns arise over the U.S. housing market as mortgage applications reach their lowest point in almost three decades, Image: BofA Global Investment Strategy
U.S. Labor Market – U.S. Nonfarm Payrolls vs. Retail Sales Higher payrolls can potentially lead to higher retail sales, as increased income for employees can result in greater purchasing power. Image: BofA Global Investment Strategy
U.S. Federal Debt and Federal Reserve Balance Sheet Are the Federal Reserve balance sheet and the U.S. federal debt on the way to the moon? Image: Real Investment Advice
Most Short Basket Rolling 3-Month Return A basket of most-shorted U.S. stocks has fallen significantly over the last three months. Image: Goldman Sachs Global Investment Research
S&P 500 and 12-Month Rate of Change in Margin Debt The rise in margin debt in June and July can be seen as a bullish signal for U.S. equities, indicating increased optimism and risk appetite among investors. Image: BofA Global Research Click the Image to Enlarge