S&P 500 – % Stocks That Are Within 10% of Their All-Time Highs Highs
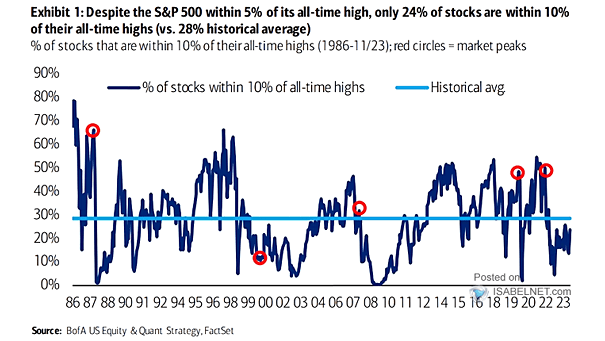
S&P 500 – % Stocks That Are Within 10% of Their All-Time Highs Highs The S&P 500 is nearing its all-time high, but only 24% of individual stocks are within 10% of their peak levels, raising concerns about market health, as gains are driven by a few large-cap stocks while others struggle to recover. Image:…