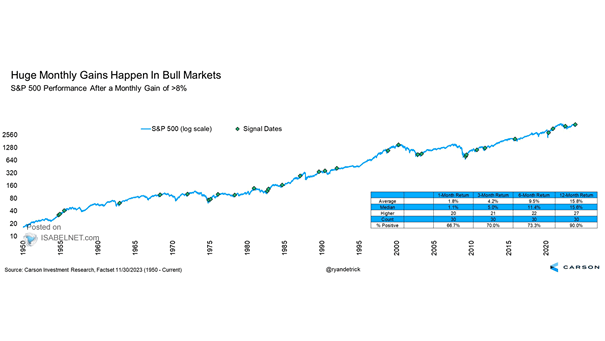
S&P 500 Performance After a Monthly Gain of >8%
S&P 500 Performance After a Monthly Gain of >8% Historically, when the S&P 500 gains more than 8% in a month, it tends to perform well in the following 12 months. On average, it has seen a 15.8% increase in value a year later. Image: Carson Investment Research