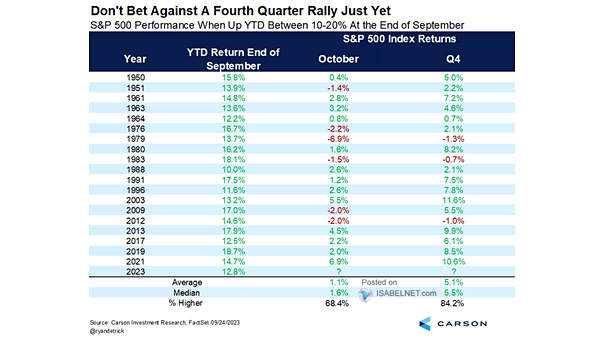
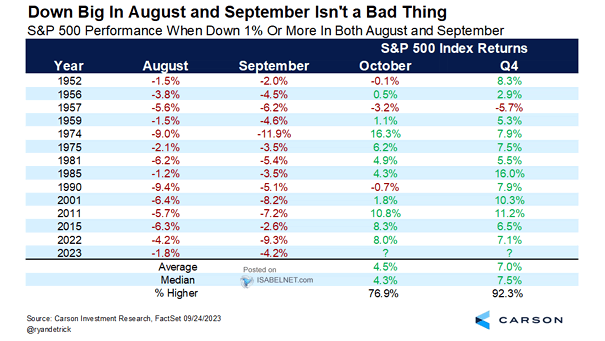
S&P 500 Rolling 12-Month % Change
S&P 500 Rolling 12-Month % Change Will the S&P 500 be positive over the next 12 months? Image: Strategas Research Partners
S&P 500 and the Small Caps vs. Large Caps Ratio The S&P 500 remains in a secular bull market. Image: BofA Global Research
Would You Rather Be Long or Short S&P 500 Volatility at the Moment? 73% of JPM clients prefer to be long S&P 500 volatility right now. Image: J.P. Morgan
U.S. 30-Year Treasury Returns After Last Rate Hike The U.S. 30-year Treasury tends to outperform in the three and six months following the last Fed rate hike. Image: BofA Global Investment Strategy
U.S. Dollar Returns After Last Rate Hike In inflationary periods, the U.S. dollar tends to rise in the three and six months following the last Fed rate hike. Image: BofA Global Investment Strategy
Valuation – Mega-Cap Tech Relative NTM P/E vs. Rest of S&P 500 The concentration of mega-cap tech stocks in the S&P 500 Index has raised concerns that the market is being pulled up by a handful of stocks. Image: Goldman Sachs Global Investment Research
Rolling 12-Month EPS Surprise vs. ISM PMI Are markets too optimistic? Image: Morgan Stanley Research
Gold Returns After Last Rate Hike Should investors sell gold after the last Fed rate hike? Image: BofA Global Investment Strategy
Performance – U.S. Banks vs. Europe Banks Can European banks continue to outperform U.S. banks in 2023? Image: BofA Global Investment Strategy
S&P 500 vs. Russell 2000 – Trailing 12-Month EPS Small cap earnings tend to lead large cap earnings. Image: BofA Global Investment Strategy
U.S. Treasury Bill Yield by Maturity A default by the U.S. government could have significant negative effects on the economy, including financial market disruptions and a loss of faith in the United States by international investors. Image: BofA Global Research