S&P 500 EPS Yield – IG Yield vs. TTM Buyback Yield
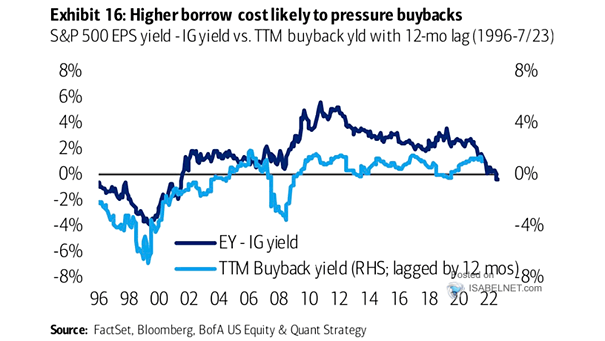
S&P 500 EPS Yield – IG Yield vs. TTM Buyback Yield Higher borrowing costs can discourage companies from engaging in stock buybacks. Image: BofA US Equity & Quant Strategy
S&P 500 EPS Yield – IG Yield vs. TTM Buyback Yield Higher borrowing costs can discourage companies from engaging in stock buybacks. Image: BofA US Equity & Quant Strategy
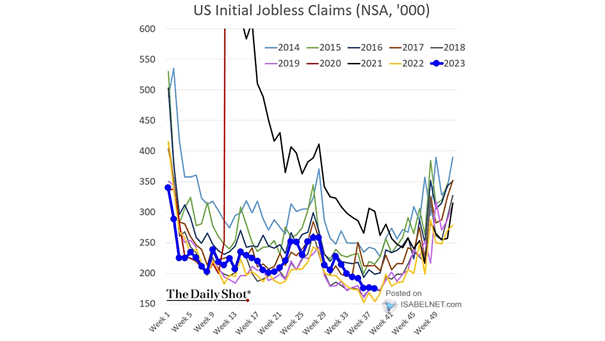
U.S. Initial Jobless Claims The U.S.’s sustained period of low initial jobless claims indicates a stable labor market. This is a positive development showing resilience in the economy and providing hope for continued growth. Image: The Daily Shot
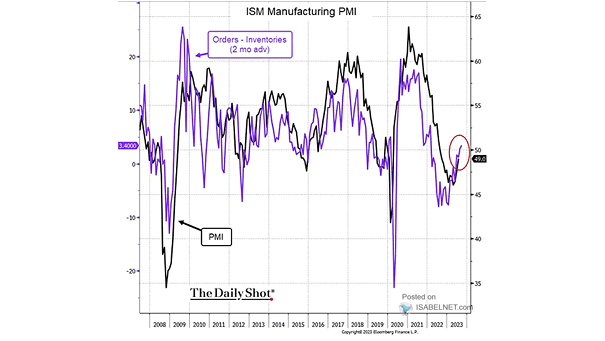
ISM Manufacturing PMI vs. ISM New Orders – Inventories The U.S. ISM New Orders less Inventories spread continues to suggest a higher ISM Manufacturing PMI. This correlation points towards a positive outlook for the manufacturing sector. Image: The Daily Shot
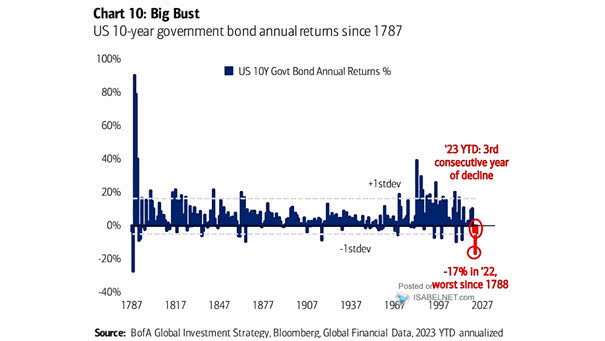
U.S. 10-Year Government Bond Annual Returns Never before has the 10-year U.S. Treasury bond experienced three consecutive years of annual declines. Is this time different? Image: BofA Global Investment Strategy
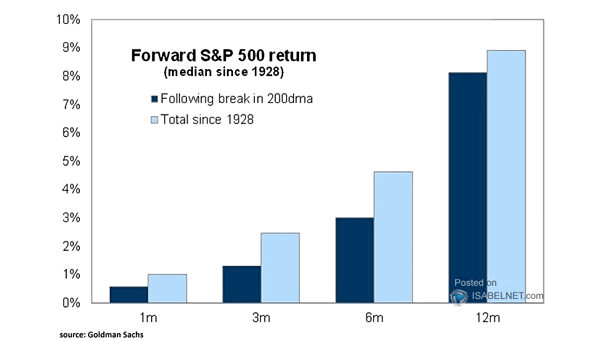
Forward S&P 500 Return Following Break in 200-DMA Staying above the 200-day moving average may provide higher forward returns for the S&P 500 index, indicating positive market momentum and potentially leading to favorable investment outcomes. Image: Goldman Sachs Global Investment Research
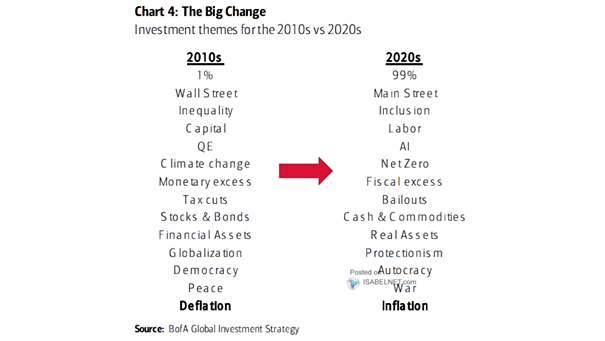
Market – Themes for the 2010s vs 2020s It is crucial to recognize the potential for a fundamental regime change, which could have far-reaching implications for investment strategies and decision-making processes. Image: BofA Global Investment Strategy
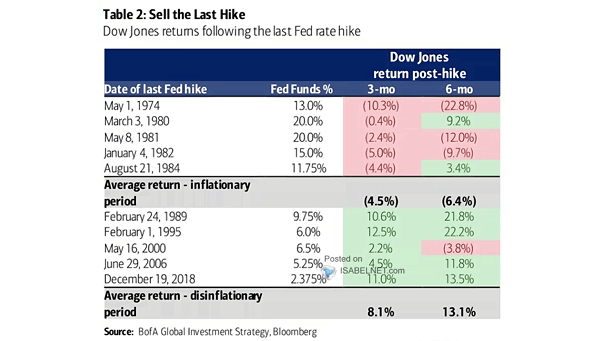
Dow Jones Industrial Average Returns Post Last Fed Rate Hike Is it advisable this time for U.S. equity investors to sell their holdings following the last Fed rate hike? Image: BofA Global Investment Strategy
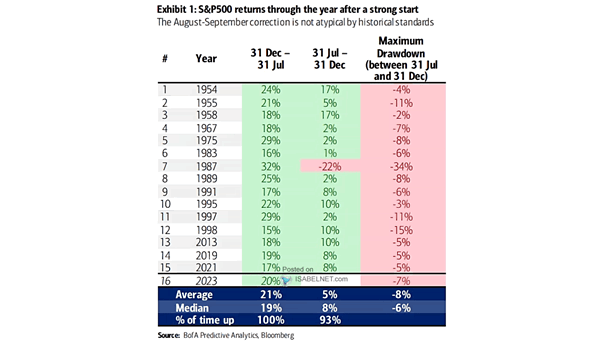
S&P 500 Returns Through the Year After a Strong Start The August-September correction in the S&P 500, following a strong start, aligns with historical standards and can be considered a normal occurrence. Image: BofA Predictive Analytics
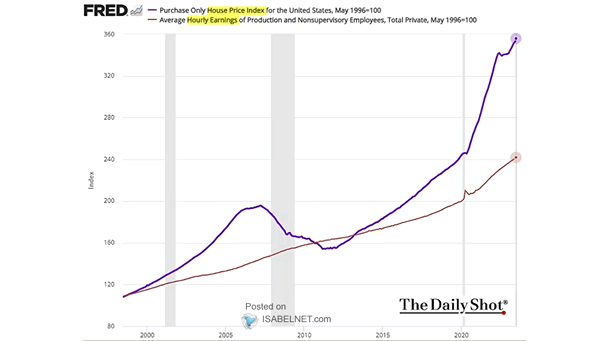
U.S. Home Prices vs. Wage Growth The widening gap between wage growth and U.S. home prices has significant implications for housing affordability and economic inequality. Image: The Daily Shot
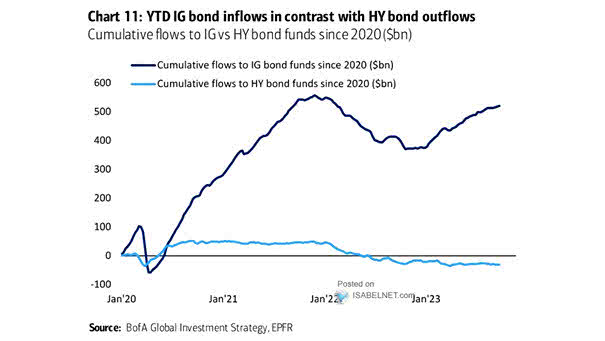
IG and HY Bond Fund Flows It is common for investors to prefer investment-grade (IG) bonds over high-yield (HY) bonds when seeking lower-risk investments. Image: BofA Global Investment Strategy
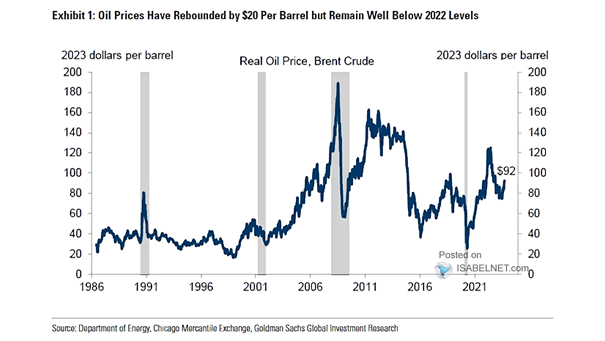
Real Oil Price and U.S. Recessions While there has been a rebound in oil prices, they are still below the levels seen in 2022. Image: Goldman Sachs Global Investment Research