Consensus U.S. GDP Growth
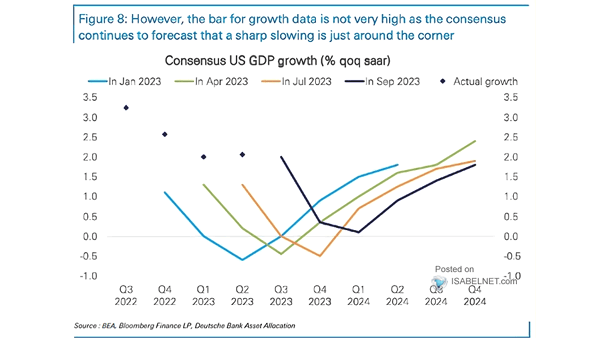
Consensus U.S. GDP Growth Could the United States experience a significant deceleration in GDP growth in the near future? Image: Deutsche Bank Asset Allocation
Consensus U.S. GDP Growth Could the United States experience a significant deceleration in GDP growth in the near future? Image: Deutsche Bank Asset Allocation
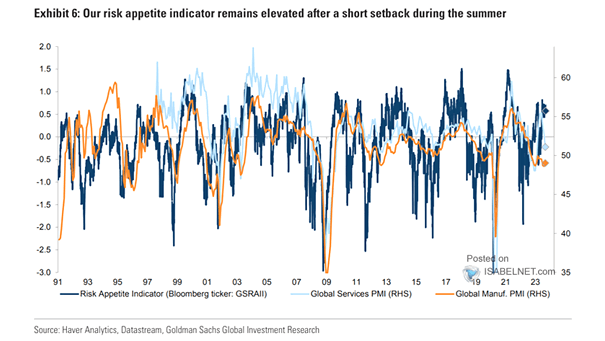
Sentiment – Global PMI and Risk Appetite Indicator The GS risk appetite indicator remaining elevated suggests that investors have a high appetite for risk in the financial markets. Image: Goldman Sachs Global Investment Research
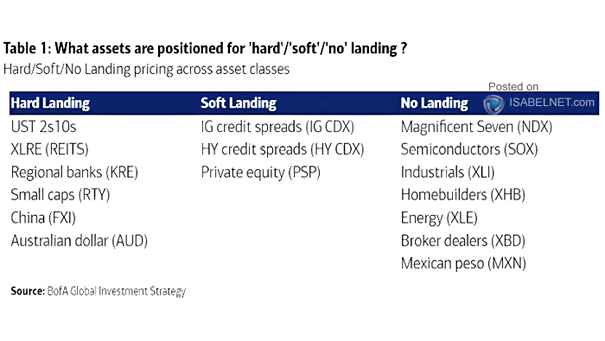
Hard/Soft/No Landing Pricing Across Asset Classes Investors may allocate cash to bonds in hard landing, a combination of stocks and credit in soft landing, commodities in no landing. Image: BofA Global Investment Strategy
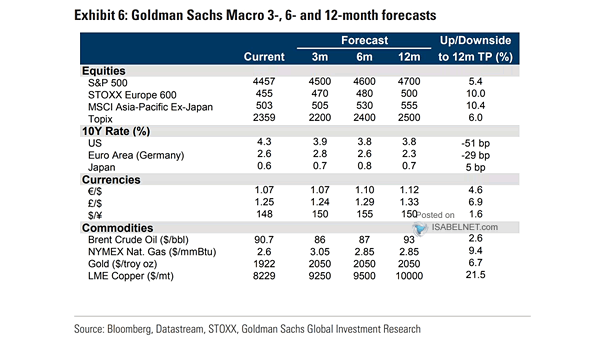
Macro Forecasts Goldman Sachs predicts that the S&P 500 will reach 4,700 and the 10-year U.S. Treasury yield will be at 3.8% in 12 months. Image: Goldman Sachs Global Investment Research
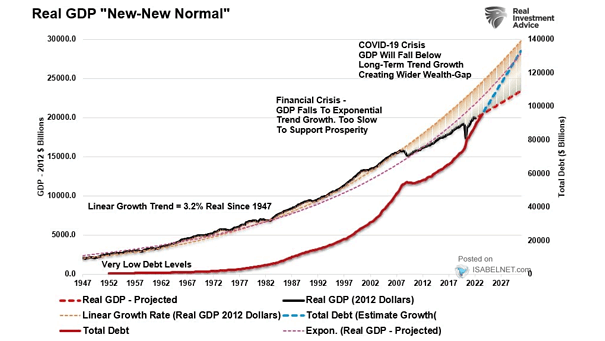
U.S. Real GDP “New-New Normal” Will a sustained period of low economic growth be the “new normal” for the United States? Image: Real Investment Advice
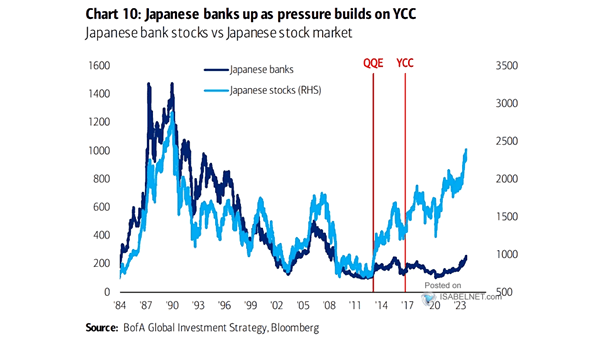
Japanese Banks Stock Price Index vs. Japanese Stocks Given the increase in Japanese government bond yields, should investors favor Japanese bank stocks? Image: BofA Global Investment Strategy
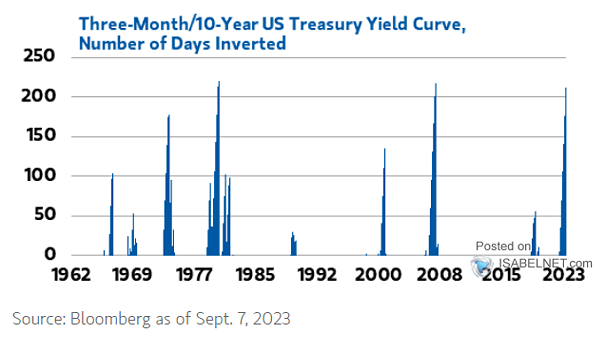
Consecutive Trading Days of Inverted 10Y-3M U.S. Treasury Yield Curve The inversion of the 10Y-3M UST yield curve typically reflects market expectations of slower economic growth and potentially lower interest rates in the future. Image: Morgan Stanley Wealth Management
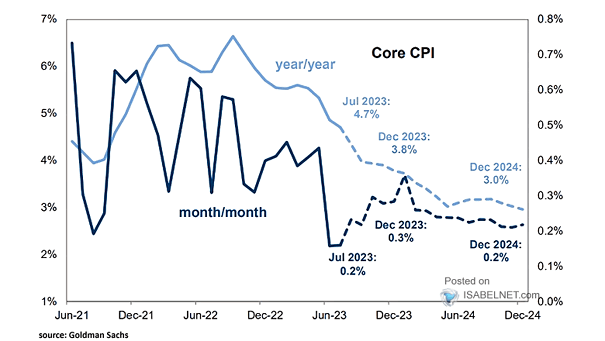
Inflation – U.S. Core CPI Goldman Sachs forecasts that U.S. core CPI will be 3.0% in December 2024. Image: Goldman Sachs Global Investment Research
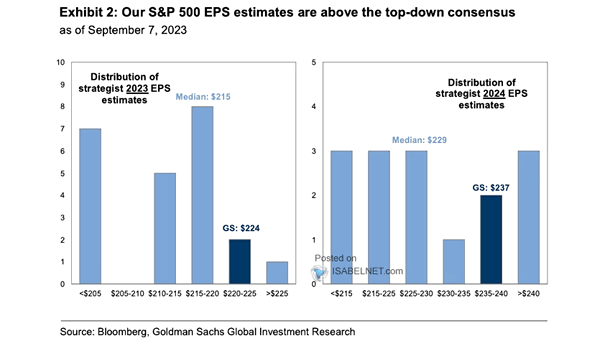
S&P 500 EPS Estimates Goldman Sachs is more optimistic than consensus on EPS estimates for 2023 and 2024. Image: Goldman Sachs Global Investment Research
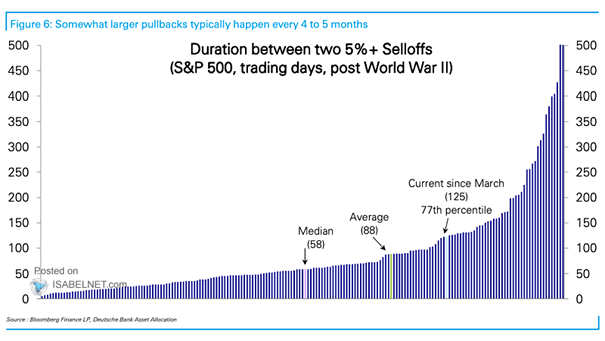
S&P 500 – Duration Between 5%+ Selloffs 5%+ selloffs in the U.S. stock market have occured within 88 trading days on average since World War II. Image: Deutsche Bank Asset Allocation
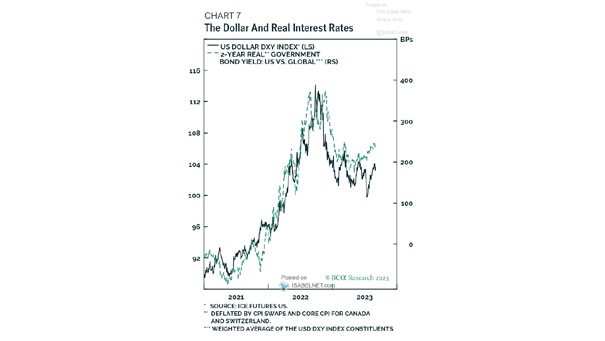
U.S. Dollar vs. Real Interest Rates Higher real interest rate differentials between the United States and the world are generally associated with a stronger U.S. dollar. Image: BCA Research