U.S. Equity Issuance
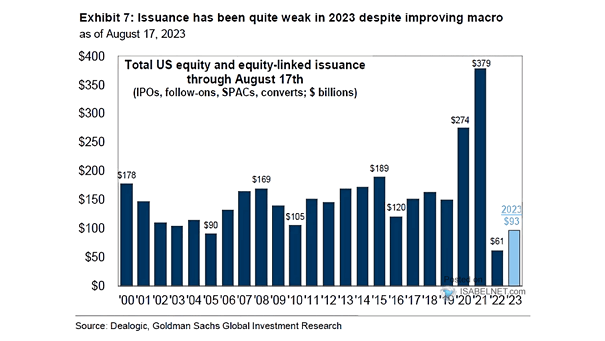
U.S. Equity Issuance Despite the improvement in macroeconomic conditions, the issuance of U.S. equity and equity-linked securities has been relatively weak this year. Image: Goldman Sachs Global Investment Research
U.S. Equity Issuance Despite the improvement in macroeconomic conditions, the issuance of U.S. equity and equity-linked securities has been relatively weak this year. Image: Goldman Sachs Global Investment Research
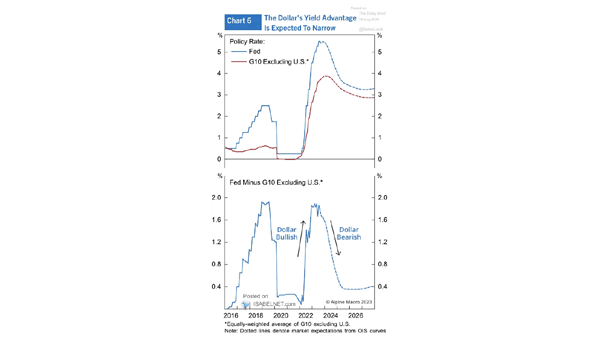
U.S. Dollar and Policy Rate: Fed Minus G10 Excluding U.S. Should investors turn bearish on the U.S. dollar? Image: Alpine Macro
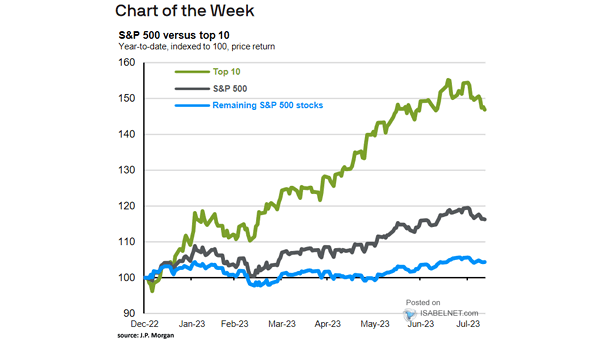
S&P 500 vs. Top 10 Investors can benefit from the currently wide valuation dispersion by focusing on low beta stocks that have stable cash flows and strong balance sheets. Image: J.P. Morgan Asset Management
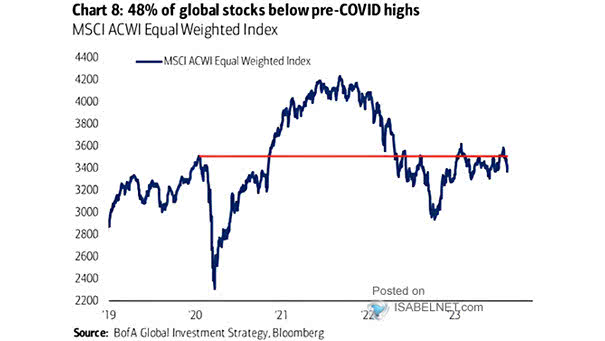
Performance – Global Equities Equal Weighted (MSCI ACWI Equal-Weighted Index) Since February 2020, the MSCI ACWI Equal-Weighted Index has done virtually nothing. Image: BofA Global Investment Strategy
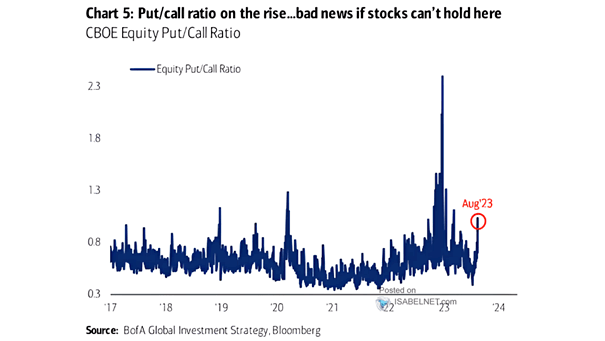
Sentiment – Equity Put/Call Ratio The CBOE U.S. equity put/call ratio is often seen as a contrarian indicator. Image: BofA Global Investment Strategy
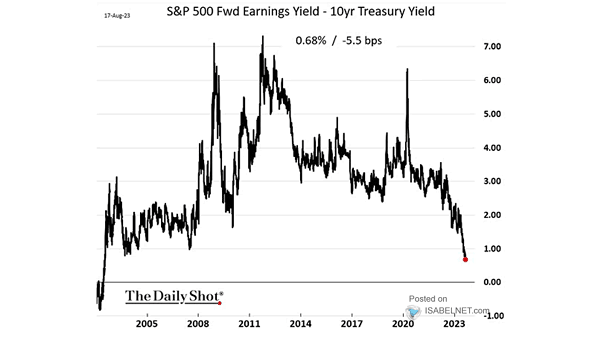
S&P 500 Fwd Earnings Yield – U.S. 10-Year Treasury Yield Can U.S. Treasury bonds be considered more attractive than U.S. stocks at present? Image: The Daily Shot
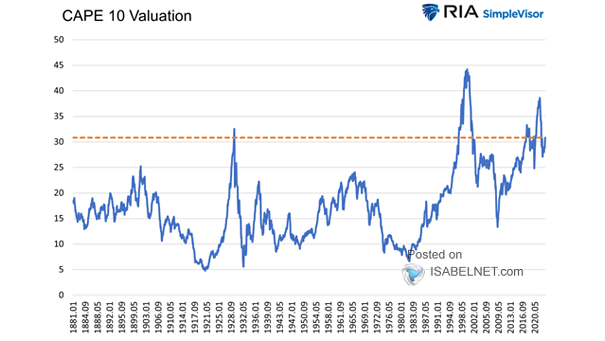
U.S. Stock Market Valuation – Cape Ratio The S&P 500’s CAPE ratio remains historically high, which could potentially lead to lower subsequent returns over the following 10 years. Image: Real Investment Advice
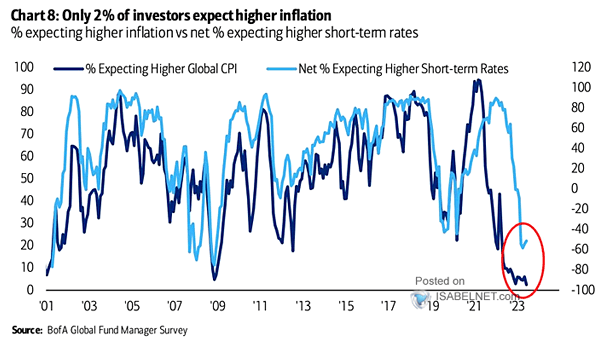
FMS Investors – Net % Expecting Higher Global CPI vs. Net % Expecting Higher Short-Term Rates There are still big expectations for inflation to fall. Image: BofA Global Fund Manager Survey
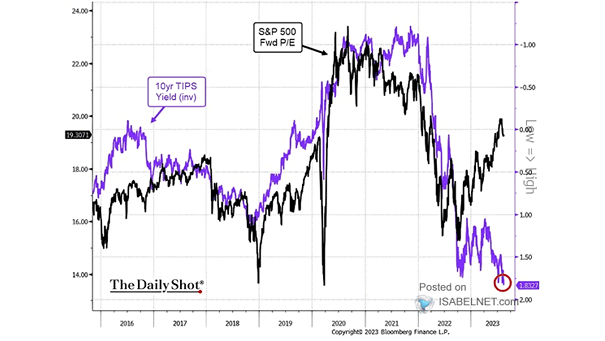
Valuation – S&P 500 Forward P/E and U.S. 10-Year U.S. TIPS Yield The S&P 500 forward P/E multiple tends to be negatively impacted by higher real interest rates. Image: The Daily Shot
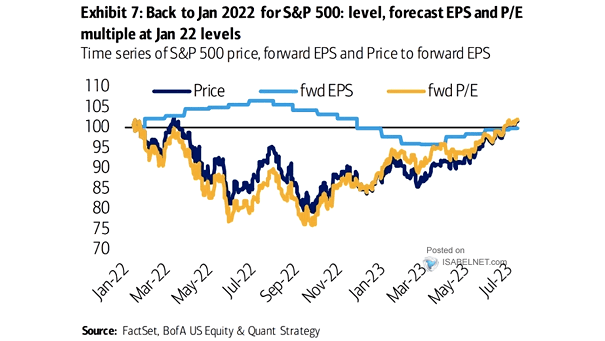
Time Series of S&P 500 Price, Forward EPS and Price to Forward EPS The S&P 500 has returned to its January 2022 level. Image: BofA US Equity & Quant Strategy
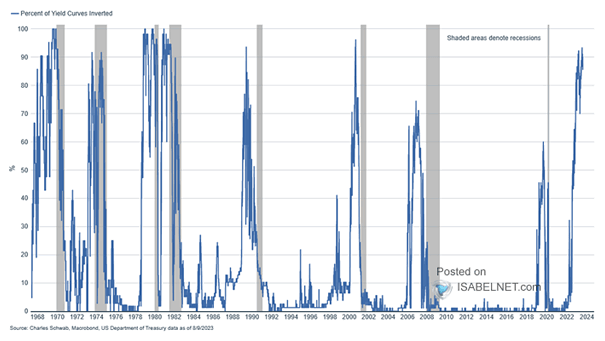
Recession – Percentage of U.S. Treasury Yield Curves Inverted The risk of a U.S. recession cannot be ruled out. Image: Charles Schwab