Investor Sentiment – Fear & Frenzy Index
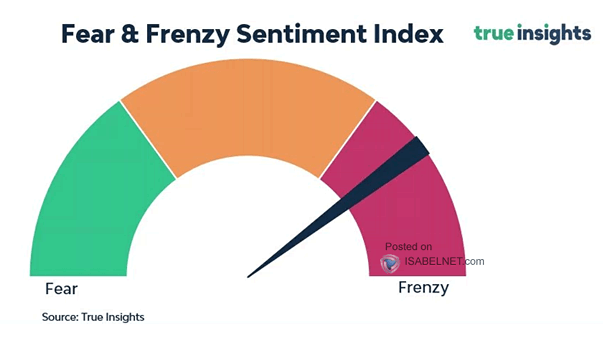
Investor Sentiment – Fear & Frenzy Index Investor sentiment remains overly optimistic. Is it time to be cautious? Image: True Insights
Investor Sentiment – Fear & Frenzy Index Investor sentiment remains overly optimistic. Is it time to be cautious? Image: True Insights
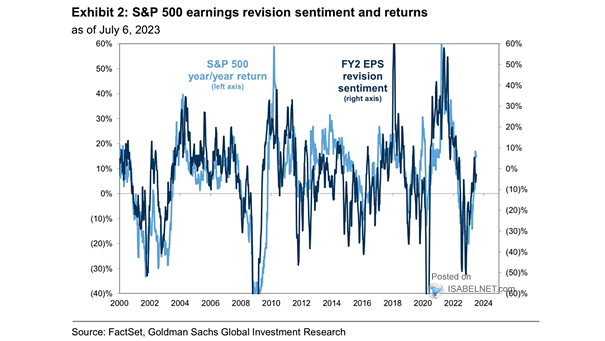
S&P 500 Earnings Revision Sentiment and Returns There is generally a good correlation between S&P 500 earnings revision sentiment and returns. Image: Goldman Sachs Global Investment Research
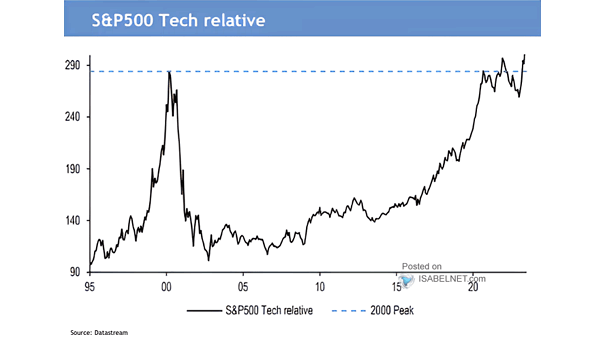
Performance – S&P 500 Tech Relative Can investors expect the outperformance of tech stocks relative to the S&P 500 to continue? Image: J.P. Morgan
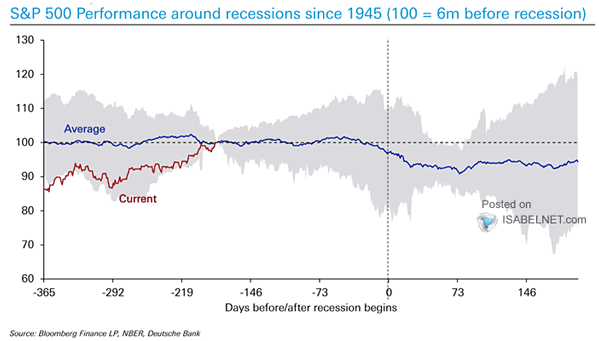
S&P 500 Performance Around Recessions In the year preceding a U.S. recession, the average performance of the S&P 500 is historically flat. Image: Deutsche Bank
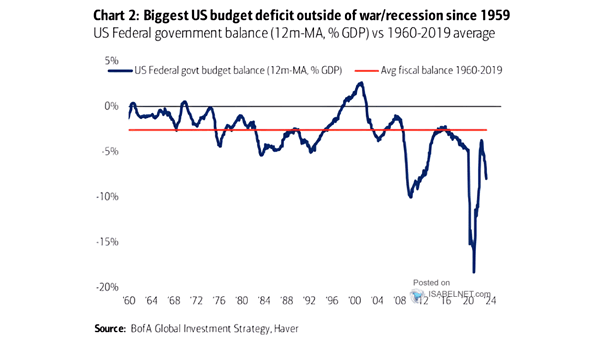
U.S. Federal Government Fiscal Balance Running deficits over an extended period of time is not a sustainable fiscal policy. Image: BofA Global Investment Strategy
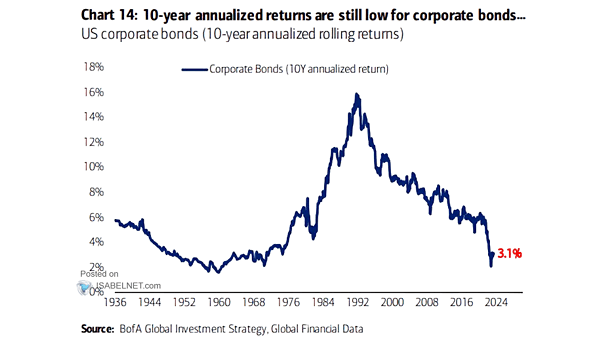
Return – U.S. Corporate Bonds Corporate bonds have produced low annualized returns over the past 10 years. Image: BofA Global Investment Strategy
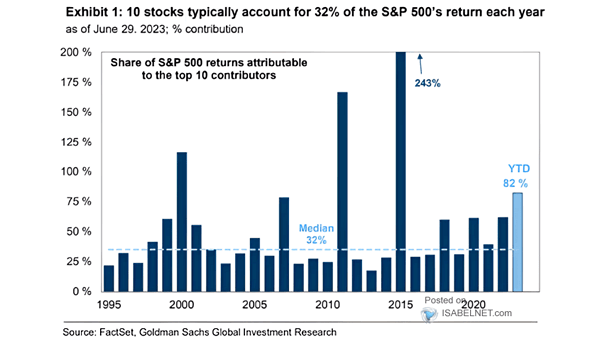
Share of S&P 500 Returns Attribuable to the Top 10 Contributors 10 stocks account for 82% of the S&P 500’s year-to-date return as of June 29. Image: Goldman Sachs Global Investment Research
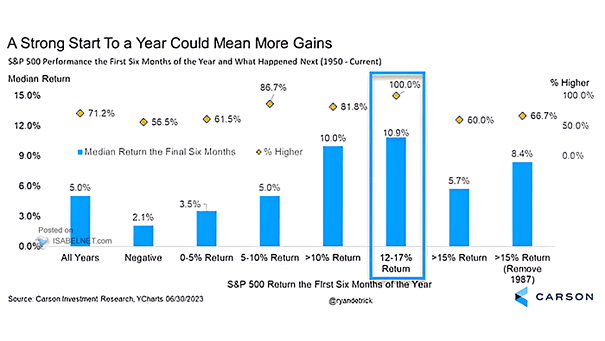
S&P 500 Performance the First Six Months of the Year and What Happened Next Historically, a strong performance of the S&P 500 in the first half of the year tends to lead to further gains in the second half. Image: Carson Investment Research
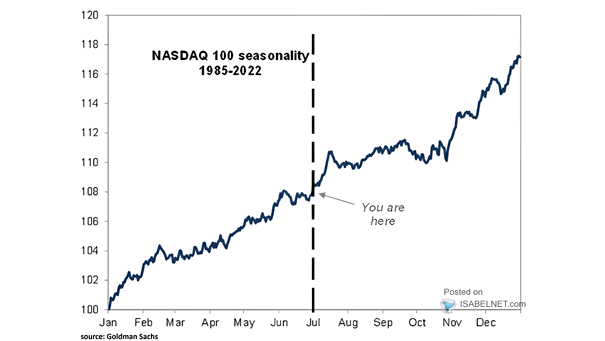
Nasdaq 100 Seasonality Historically, July tends to be a good month for the Nasdaq 100 index, with seasonal patterns showing positive performance. Image: Goldman Sachs Global Investment Research
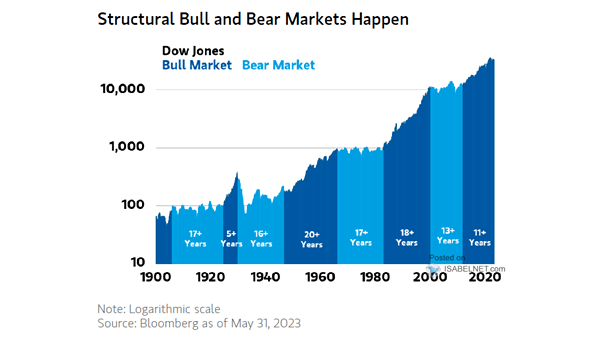
Structural Bull and Bear Markets Structural bear markets can be very painful for investors, as they can lead to prolonged periods of market decline and economic hardship. Image: Morgan Stanley Wealth Management
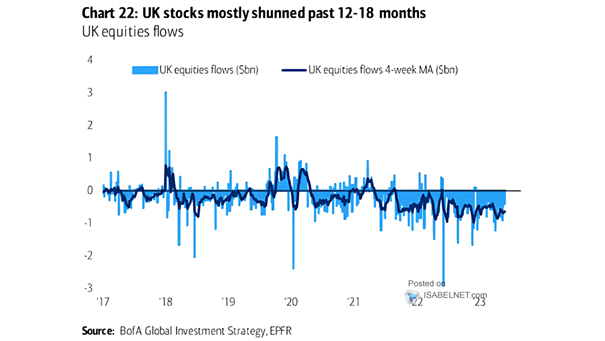
UK Equities Flows UK equities continue to experience outflows. Image: BofA Global Investment Strategy