S&P 500 Index – Bull vs. Bear Market
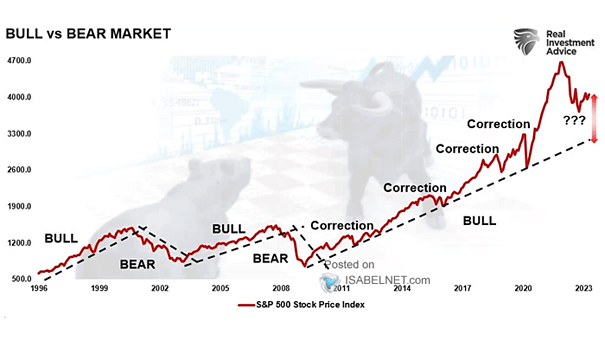
S&P 500 Index – Bull vs. Bear Market Will the S&P 500 return to its all-time high as it remains in a long-term trending bull market? Image: Real Investment Advice
S&P 500 Index – Bull vs. Bear Market Will the S&P 500 return to its all-time high as it remains in a long-term trending bull market? Image: Real Investment Advice
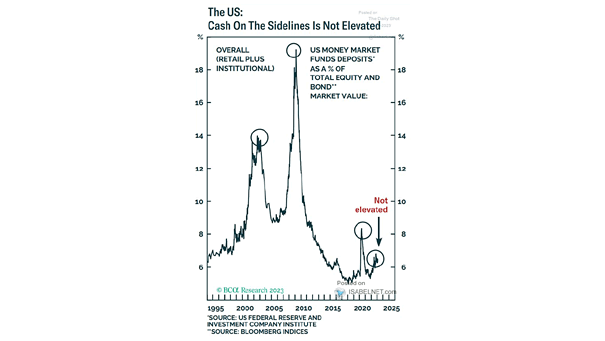
Cash – U.S. Money Market Funds Deposits as a % of Total Equity and Bond Market Value Cash on the sidelines is not as elevated as many believe. Image: BCA Research
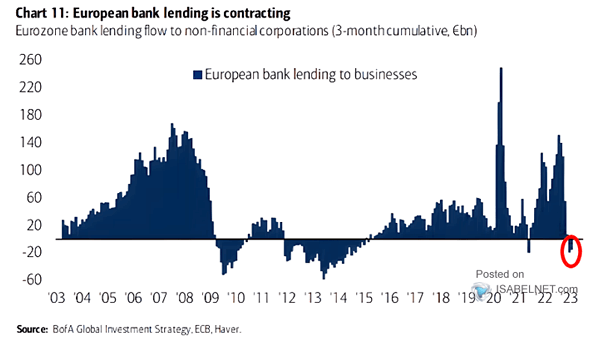
Eurozone Bank Lending Flow to Non-Financial Corporations Bank lending in the European area is contracting, which is unusual outside of crises. Image: BofA Global Investment Strategy
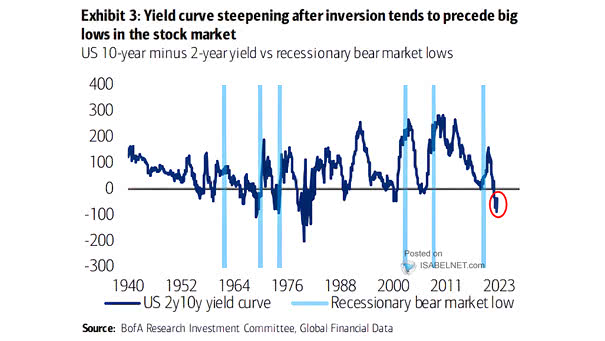
U.S. 10Y-2Y Yield Curve vs. Recessionary Bear Market Lows Historically, a steepening inverted US 10Y-2Y yield curve tends to precede recessionary bear market lows. Image: BofA Research Investment Committee
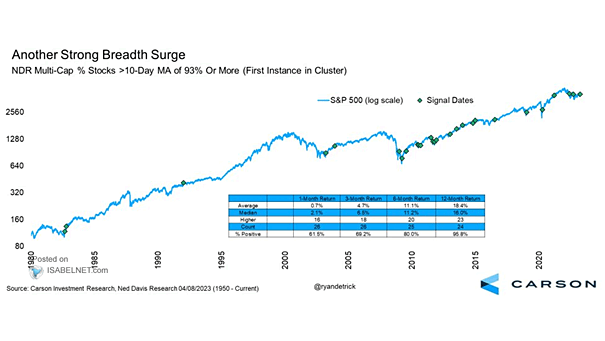
S&P 500 – NDR Multi-Cap % Stocks >10-Day Monving Average of 93% or More In recent history, when 93% of U.S. stocks or more are above their 10-day moving average, good things tend to happen over the next 12 months. Image: Carson Investment Research
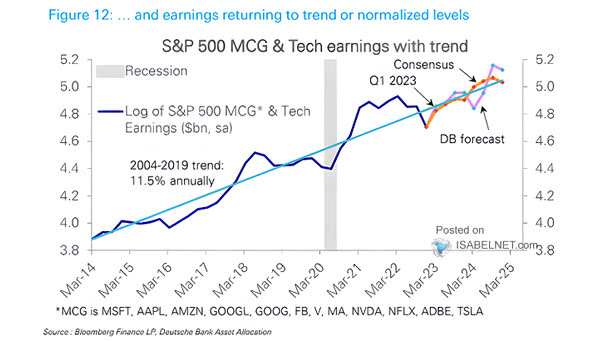
Mega-Cap Growth and Tech Earnings Do U.S. tech stocks still have room to climb? Deutsche Bank expects tech earnings to rebound. Image: Deutsche Bank
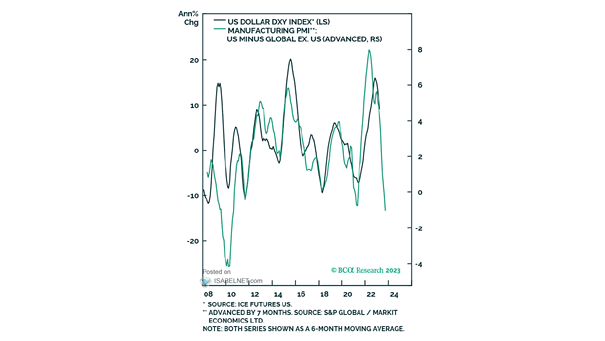
U.S. Dollar Index (DXY) vs. Manufacturing PMI (U.S. Minus Global Ex-U.S.) Will the U.S. dollar continue to weaken? Image: BCA Research
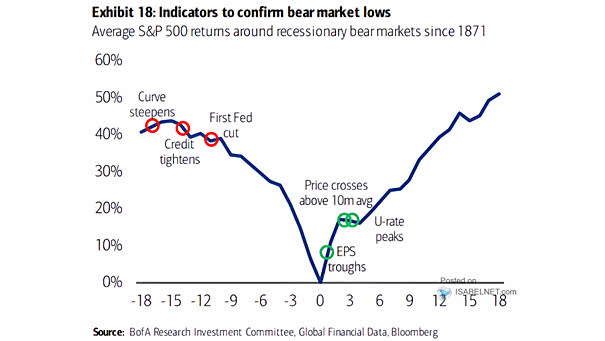
Average S&P 500 Returns Around Recessionary Bear Markets There are several indicators that can be used to confirm recessionary bear market lows. Image: BofA Research Investment Committee
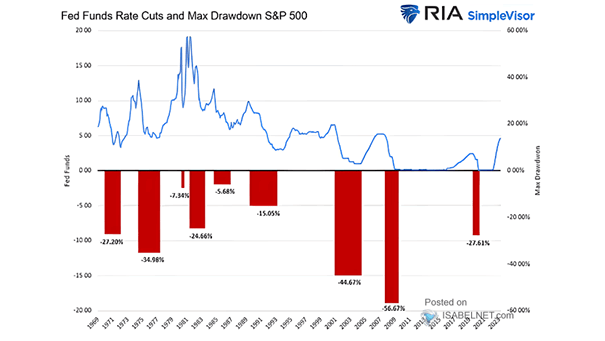
Fed Funds Rate Cuts and Max Drawdown S&P 500 Historically, Fed rate cuts are not bullish for the S&P 500. Image: Real Investment Advice
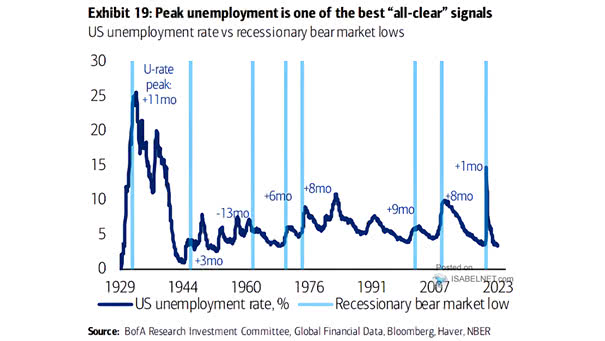
U.S. Unemployment Rate vs. Recessionary Bear Market Lows The peak in unemployment can be used as a signal for the end of a recessionary bear market in U.S. stocks. Image: BofA Research Investment Committee
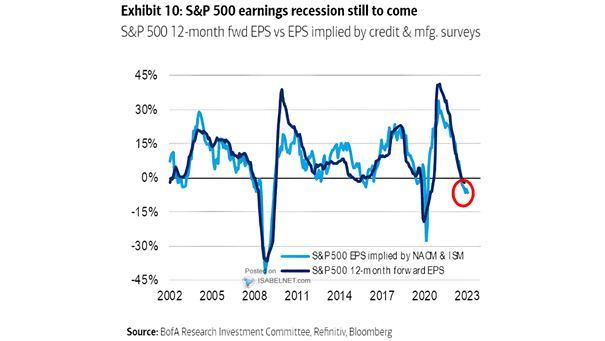
Earnings – S&P 500 12-Month Fwd EPS vs. EPS Implied by Credit and Manufacturing Surveys Could an earnings recession be a significant risk for U.S. stocks? Image: BofA Research Investment Committee