S&P 500 ERP and S&P 500 Fwd vs. Trailing EPS
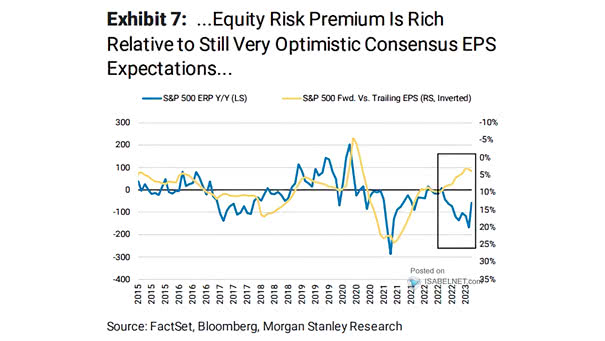
S&P 500 ERP and S&P 500 Fwd vs. Trailing EPS The S&P 500 looks unattractive until the equity risk premium increases. Image: Morgan Stanley Research
S&P 500 ERP and S&P 500 Fwd vs. Trailing EPS The S&P 500 looks unattractive until the equity risk premium increases. Image: Morgan Stanley Research

Dividend Yield Global ex-U.S. equities continue to offer higher dividend yields than U.S. equities. Image: Topdown Charts
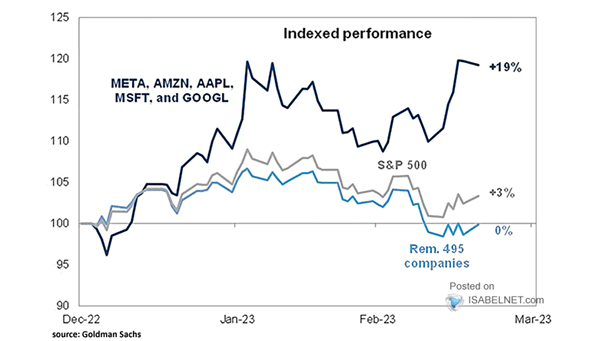
FAAMG vs. S&P 500 and Remaining 495 Companies Will FAAMG’s outperformance persist in a stagflation environment? Image: Goldman Sachs Global Investment Research
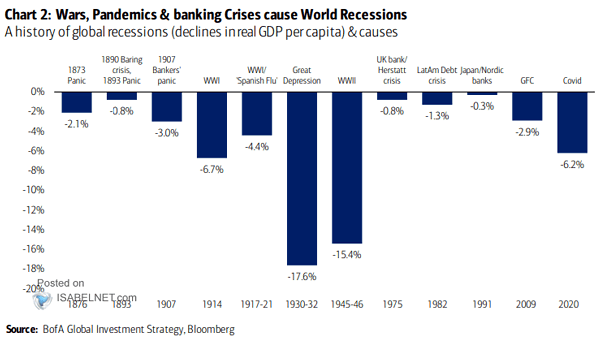
A History of Global Recessions and Causes Historically, banking crises, wars and pandemics cause global recessions. Image: BofA Global Investment Strategy
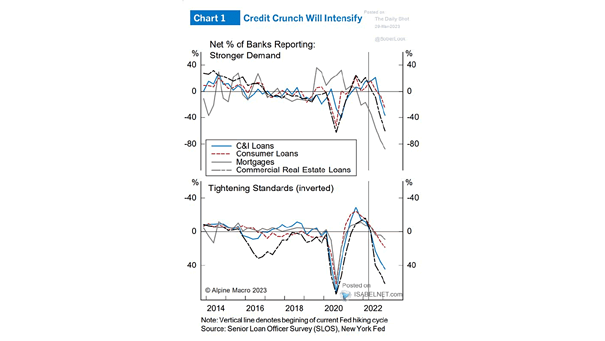
Recession – Net % of Banks Reporting Stronger Demand vs. Tightening Standards Will the credit crunch lead to a recession in the United States? Image: Alpine Macro
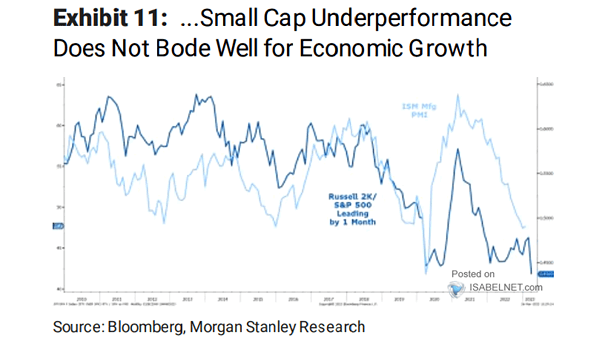
Russell 2000 / S&P 500 vs. ISM Manufacturing PMI (Leading Indicator) The performance of U.S. small caps relative to the S&P 500 suggests a decline in the ISM Manufacturing PMI. Image: Morgan Stanley Research
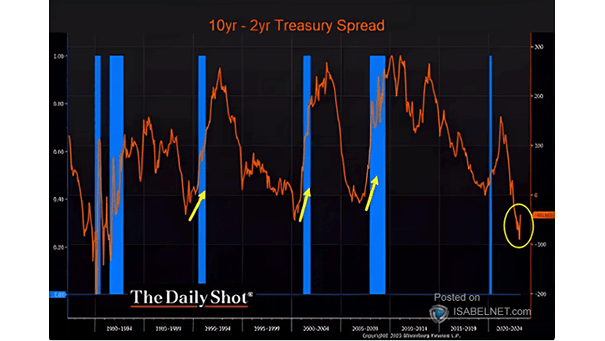
Yield Curve – U.S. 10-Year – 2-Year Government Bond Spread Historically, the re-steepening of the 10Y-2Y U.S. Treasury yield curve from the trough has preceded recessions. Image: The Daily Shot
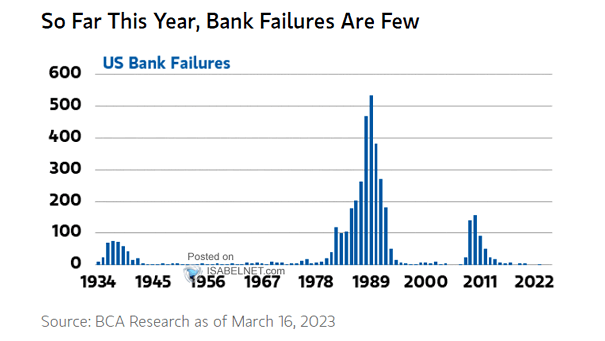
U.S. Bank Failures U.S. bank failures could lead to wider economic impacts, both within the Unites States and around the world. Image: Morgan Stanley Wealth Management
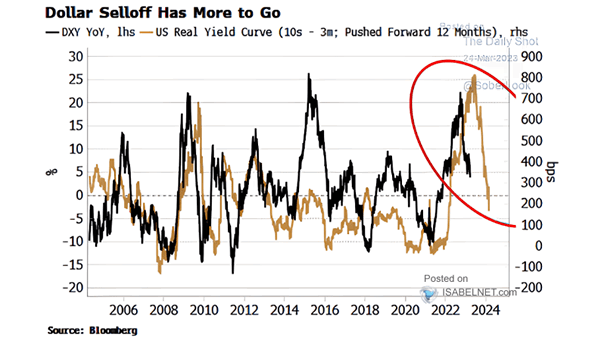
U.S. Dollar Index vs. 10Y-3M Real U.S. Yield Curve The 10Y-3M real U.S. yield curve suggests a weaker U.S. dollar over the next 12 months. Image: Bloomberg
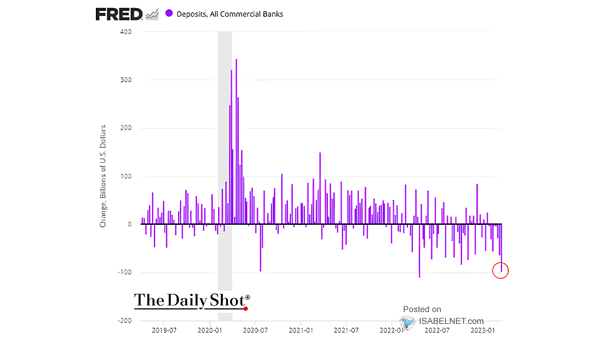
Deposits, All Commercial Banks Will U.S. banks continue to experience a decline in deposits. Image: The Daily Shot
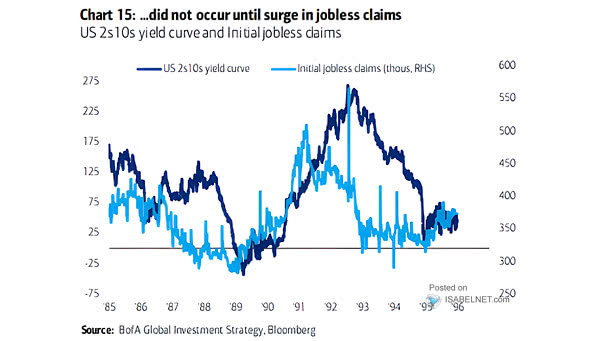
U.S. 10Y-2Y Yield Curve and Initial Jobless Claims A steepening yield curve tends to occur when jobless claims surge. Image: BofA Global Investment Strategy