Peak to Trough S&P 500 Price Decline Around Recessions
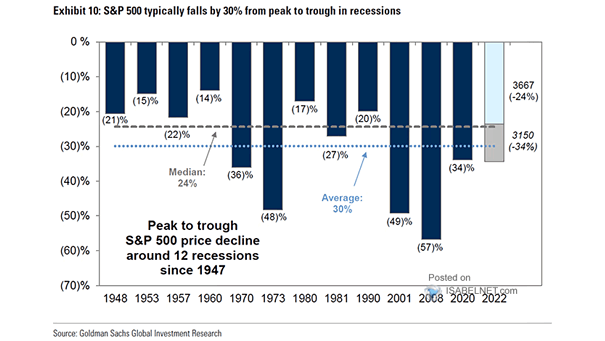
Peak to Trough S&P 500 Price Decline Around Recessions Could the S&P 500 fall more than 30% from peak to trough in a hard landing scenario? Image: Goldman Sachs Global Investment Research
Peak to Trough S&P 500 Price Decline Around Recessions Could the S&P 500 fall more than 30% from peak to trough in a hard landing scenario? Image: Goldman Sachs Global Investment Research
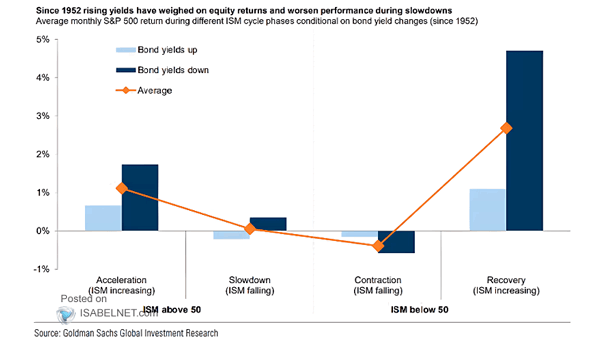
Average Monthly S&P 500 Return During Different ISM Cycle Phases Conditional on Bond Yield Changes Historically, rising bond yields are a headwind for U.S. equity returns. Image: Goldman Sachs Global Investment Research
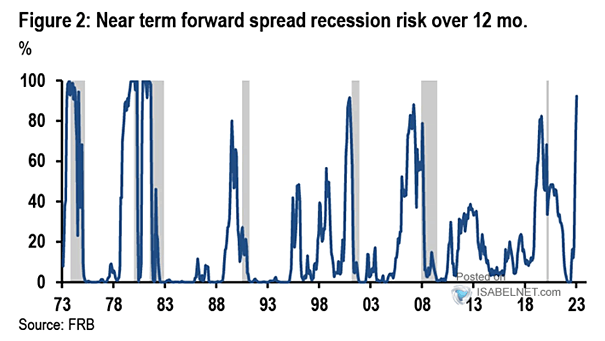
Near Term Forward Spread Recession Over 12 Months The near-term forward spread indicator (spread between U.S. 3-month rates and the U.S. 3-month rate 18 months forward) is flashing red. Image: J.P. Morgan
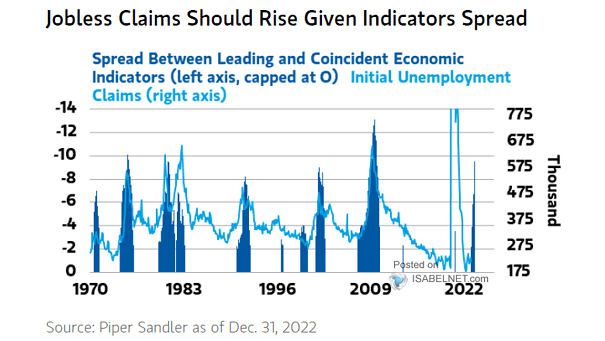
U.S. Labor Market – Spread Between Leading and Coincident Economic Indicators and Initial Unemployment Claims U.S. jobless claims are still near historic lows, but are expected to rise in the near future. Image: Morgan Stanley Wealth Management
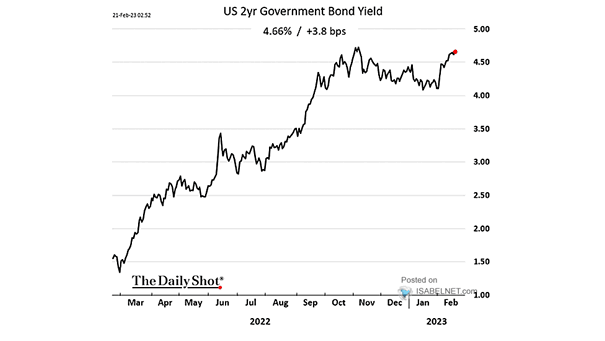
U.S. 2-Year Government Bond Yield The 2-year U.S. Treasury yield is rising as U.S. inflation may be more persistent than expected, which remains a headwind for U.S. stocks. Image: The Daily Shot
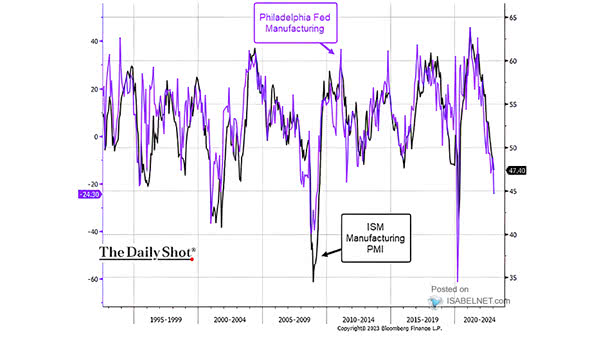
Philadelphia Fed Manufacturing Index vs. U.S. ISM Manufacturing PMI The Philly Fed Manufacturing Index could lead to a further dip in the ISM Manufacturing PMI. Image: The Daily Shot
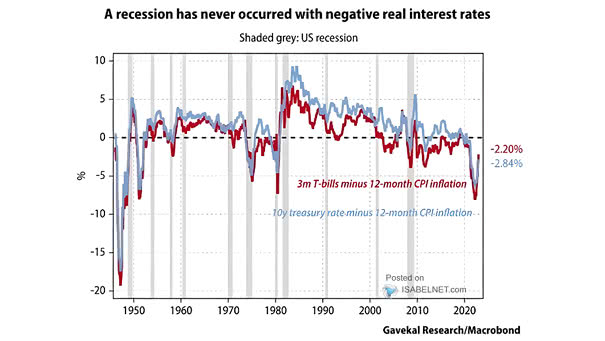
U.S. Recession – 3-Month T-Bills Minus 12-Month CPI Inflation and 10-Year Treasury Rate Minus 12-Month CPI Inflation Historically, there has never been a recession in the United States with negative real interest rates. Image: Gavekal, Macrobond
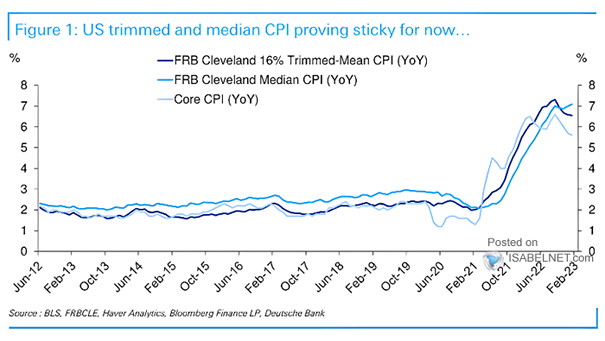
Inflation – U.S. Trimmed and Median CPI Trimmed and median CPI remain sticky so far, which suggests that further rate hikes may be needed to tame inflation. Image: Deutsche Bank
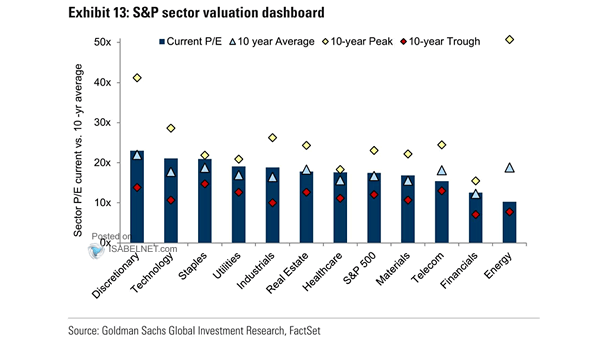
S&P Sector Valuation Dashboard The S&P energy sector still looks attractive. Image: Goldman Sachs Global Investment Research
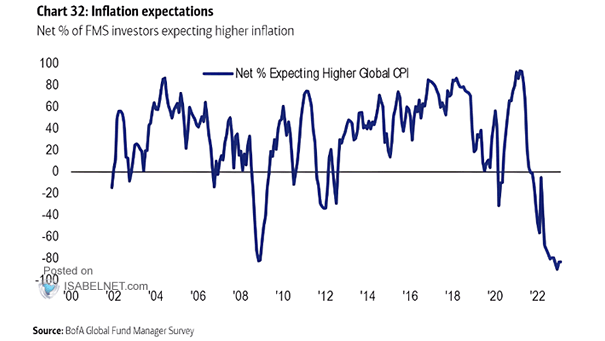
Inflation – Net % Expecting Higher Global CPI Almost all FMS investors expect inflation rates to fall. Image: BofA Global Fund Manager Survey
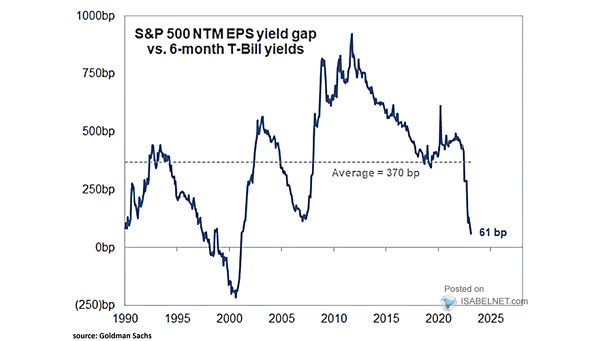
S&P 500 NTM EPS Yield Gap vs. 6-Month T-Bill Yields Cash is becoming an attractive option for investors. Image: Goldman Sachs Global Investment Research